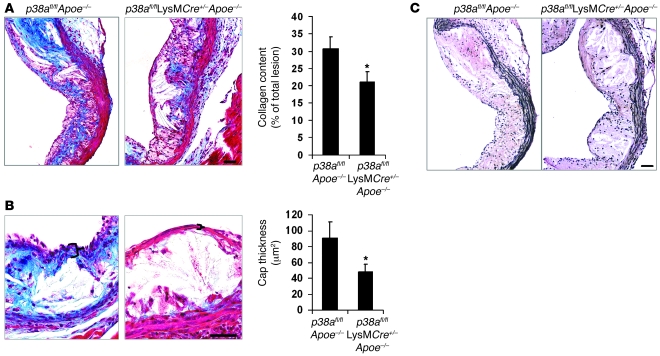
Figure 4. Fibrous cap thinning and collagen depletion in plaques deficient in macrophage p38α MAPK.
(A–C) Masson trichrome stain for collagen (blue) and elastin in p38afl/flApoe–/– and p38afl/flLysMCre+/–Apoe–/– lesions. (A) Quantified data are expressed as the average percent collagen relative to total lesion area (n = 9 per genotype). (B) Fibrous cap thickness was measured and quantified. Mean values of data from 9 mice are shown. Bracketed regions show a representative measurement of the fibrous and afibrous cap in the p38afl/flApoe–/– and p38afl/flLysMCre+/–Apoe–/– mice, respectively. (C) Elastin (black) in the tunica media. *P < 0.05 versus p38afl/flApoe–/–, Mann-Whitney U test. Scale bars: 50 μm.

