
Figure 1.
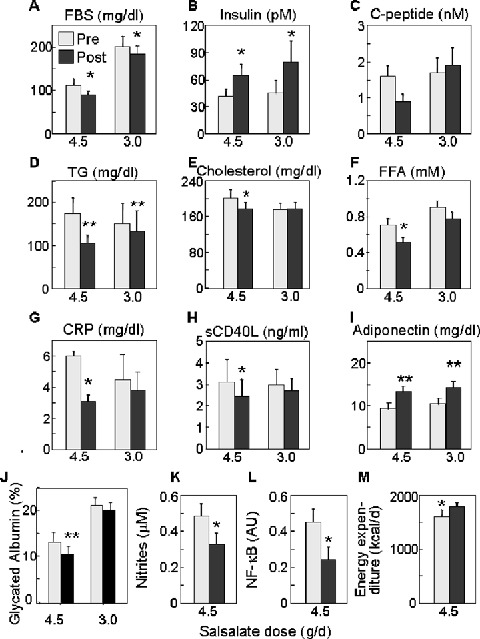
Metabolic parameters in subjects prior to treatment (pre, grey boxes) and after 2‐week treatment with 4.5 g/d (n= 7) or 3.0 g/d (n= 9) salsalate (post, black boxes). Fasting data are displayed for (A) blood glucose (mg/dL × 0.0555 = mmol/L), (B) insulin (pM/6.945 =μU/mL), (C) C‐peptide (nM/0.333 = ng/mL), (D) triglyceride (TG, mg/mL × 0.0113 = mmol/L), (E) total cholesterol (mg/dL × 0.0259 = mmol/L), (F) free fatty acids (FFA, mM), (G) C‐reactive protein (CRP, mg/dL), (H) sCD40L (ng/mL), (I) adiponectin (mg/dL), (J) glycated albumin (%), (K) nitrites (μM), (L) NF‐κB activity (arbitrary units), and (M) energy expenditure (kcal/d). Data represent mean ± SEM; *p < 0.05, **p < 0.005.