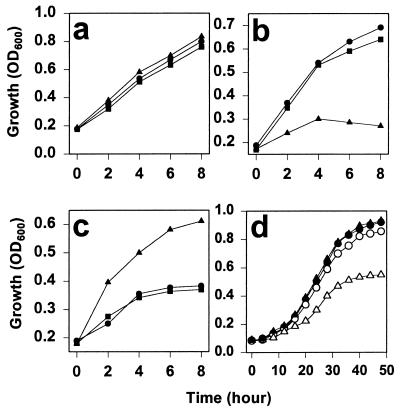
Figure 1.
Growth of yeast strains under stress. (a) Growth, measured as increasing turbidity, as a function of time for the wild-type strain (●), the Δfmo strain (▴), and the FMO plasmid-rescued strain of the deletion mutant (■). (b) The same strains in the presence of a reductive stress (5 mM DTT). (c) The growth of those strains under the oxidative stress of 2.5 mM diamide. (d) The growth of these strains under the stress of overexpression of chitinase from a plasmid (pGAL-chit). Minimal medium reduces overall growth levels, and chitinase expression was induced by 2% galactose. Symbols are as above except that open figures indicate the expression of chitinase from a plasmid (pGAL-chit).

