
Fig. 2.
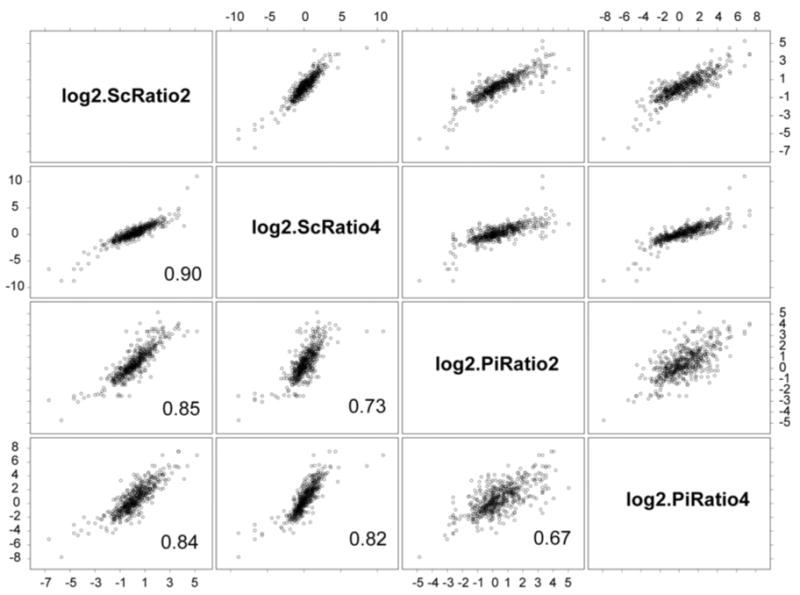
Scatter plot matrix generated in S-PLUS 6.0 (www.insightful.com) showing correlation coefficients for the four methods. The scatter plots were generated from 528 data points for the PG_PP/PG_PPC expression ratios. See Table 1 and the Introduction for definitions of the variables.