


Fig. 3.
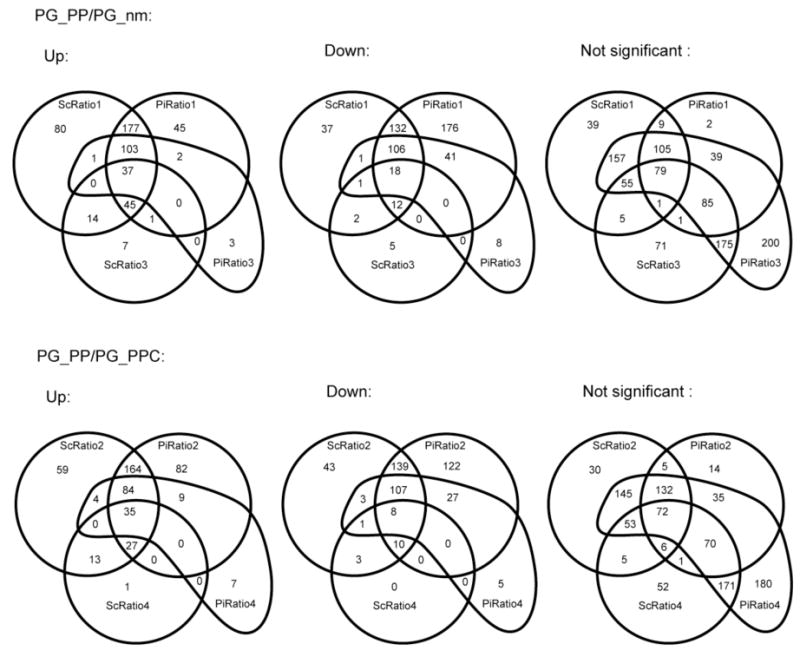
Standard four-statement Venn diagrams showing the overlap of detected significant and non-significant expression changes among the four different non-labeling quantitation methods (see Table 1 for definitions). The criteria for determining significance was the following: for protein level ratios, the q-value was less than 0.05; for peptide level ratios, the log2 ratio − SD was > 0 or the log2 ratio + SD was < 0.