


Fig. 4.
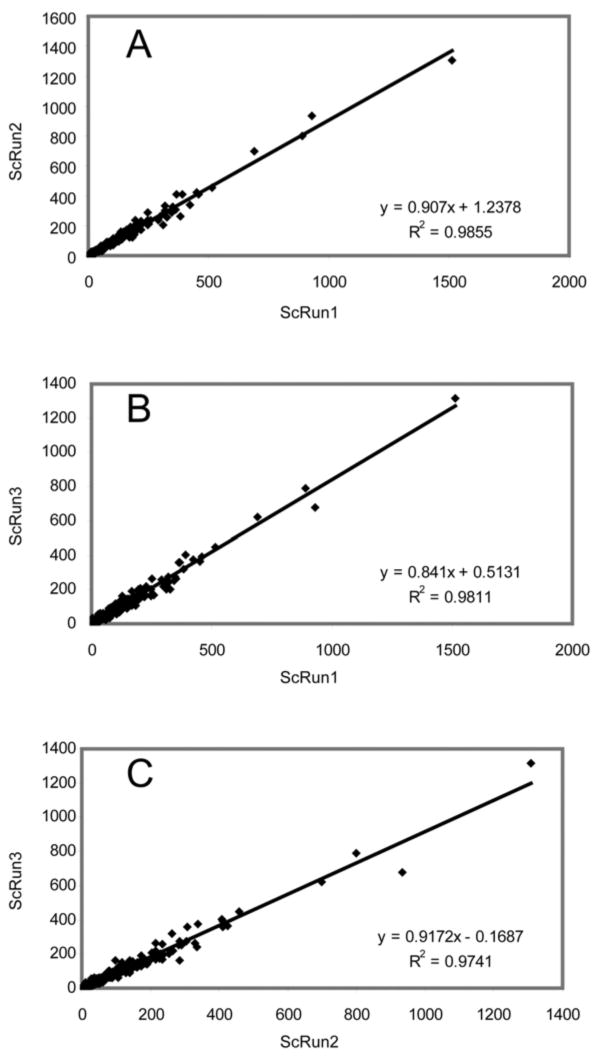
Scatter plots on a linear scale and correlation statistics for spectral counts from three technical replicates of PG_PP, showing repeatability of the spectral count method. Each data point represents the number of peptide MS1 spectra retained for each protein. These plots were generated in S-PLUS 6.0 (www.insightful.com) for proteins commonly identified in all three runs.