


Fig. 7.
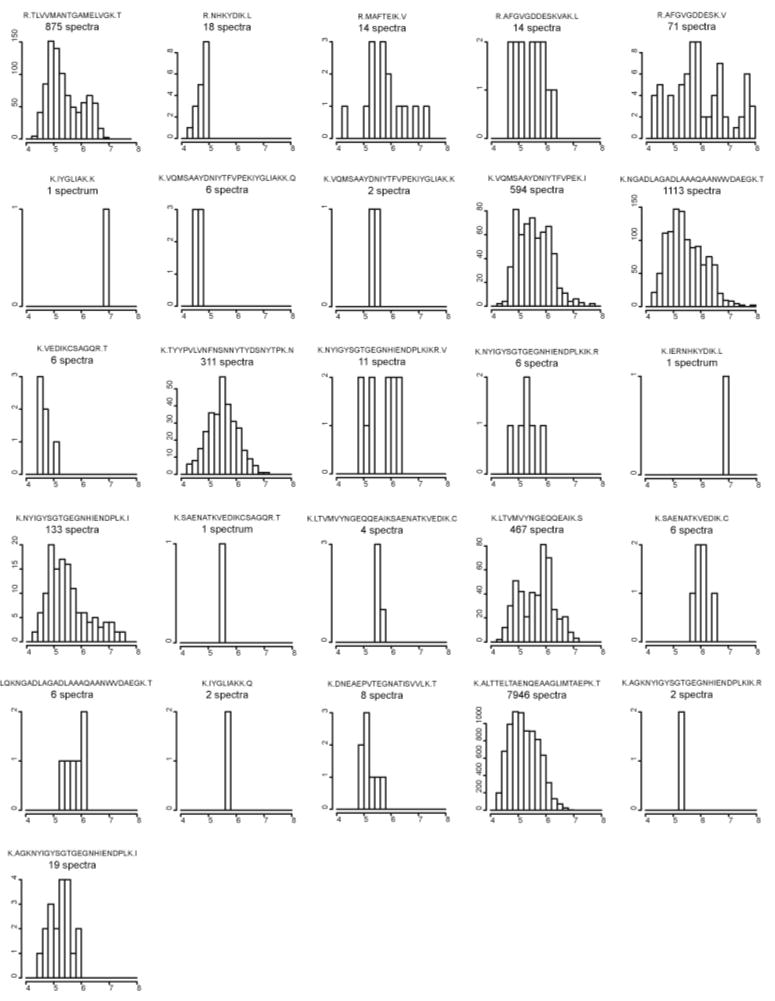
Frequency histograms of 26 identified peptides of P13793|FMA_PORGI, major fimbrillin A observed in sample PG_nm. The large variations in spectral counts and intensity distributions between different peptides can explain why the relative standard deviations of peptide level methods are so high. The y-axis of each histogram represents the number of peptide spectra in each bin. The x-axis represents signal intensity in units of log10 data system counts.