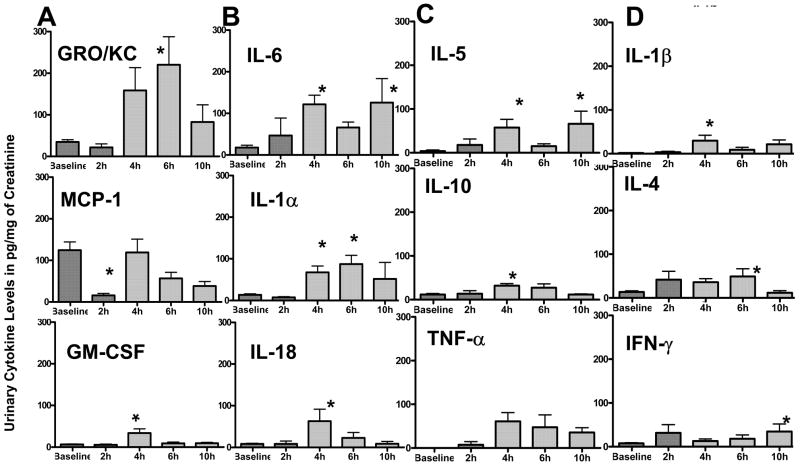
Figure 1. A–D. Temporal profile of urinary cytokines following CYP-injection.
1A) Urine levels of cytokines normalized to creatinine excretion in urine at baseline and at 2, 4, 6 and 10h after CYP injection. A 5–6 fold increase relative to baseline in the levels of GRO/KC, IL-6, IL-1α and GM-CSF was seen at 4h compared to a 10 fold increase in the levels of IL-18 at the same time point (*p<0.05; Fig 1A&B). Levels of MCP-1 showed a significant decrease of eight fold at 2h relative to baseline (*p<0.05; middle panel of Fig. 1A). A 15 fold significant rise relative to baseline was observed in levels of IL-5 and IL-1β at 4h time point (*p<0.05; top panels of Fig 1C&D). A three fold increase relative to baseline was seen in the levels of IL-10 and IL-4 at 4 and 6h, respectively (*p<0.05; middle panels of Fig 1 C&D, respectively). Levels of IFN-γ showed a significant 4- fold by 10h, whereas a 60 fold rise of TNF-α at 4h did not reach statistical significance (bottom panels of Fig 1C&D). Values are expressed as mean ± SEM and considered significant relative to baseline at p <0.05*; n=8.

