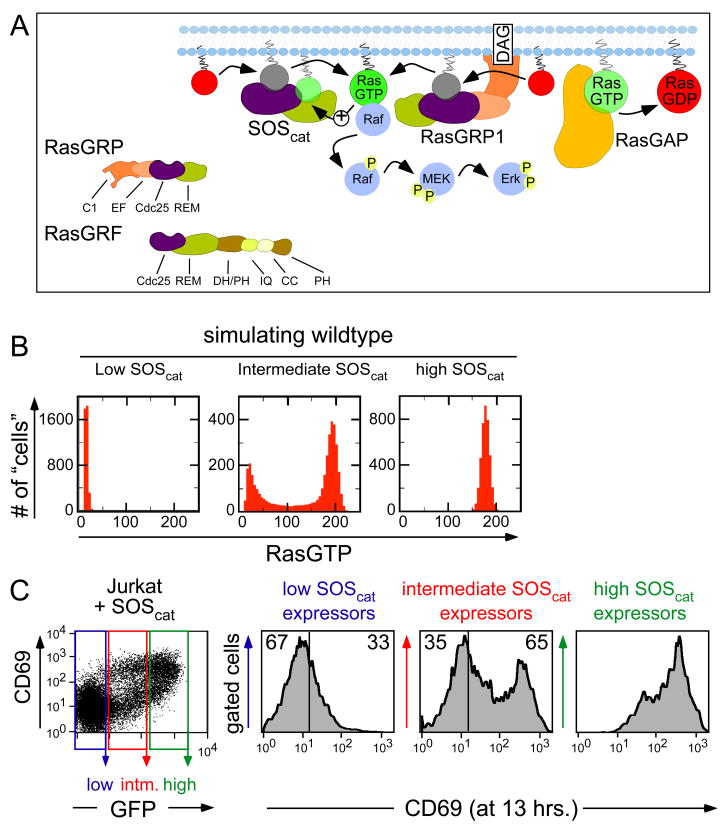
Figure 2. Bimodal Ras activation induced by SOScat operating in the Ras signaling network occurs in a stochastic model and in a T cell line.
(A) Representation of SOScat function in the context of the Ras signaling network. Besides SOS-1 and -2, lymphocytes express the RasGEFs RasGRP-1 and -3 and RasGRF2. C1 = DAG-binding C1 domain, EF = calcium-binding EF hand. IQ = motif for calcium/calmodulin binding, CC = coiled coil. RasGTP produced by RasGRP1 can influence SOS′ activity via the allosteric pocket. Of note, deficiency of RasGRF2 does not appear to impact T cell Ras activation but influences the calcium-NFAT pathway (Ruiz et al., 2007).
(B) Distributions of RasGTP calculated from our stochastic simulation algorithm at low, intermediate, or high levels of SOScat (2 fold increments) in a wild type “cell”. At intermediate levels of SOScat a bimodal RasGTP pattern arises. See Section II (Tables S4-S8, Figures S5-S12) for additional information.
(C) Introduction of intermediate levels of SOS1cat into a wildtype Jurkat T cell line leads to bimodal upregulation of CD69. Cells were cotransfected with ten μg of GFP- and ten μg of SOS1cat -expressing plasmid. The dot plot depicts CD69 and GFP expression on individual cells, analyzed by FACS. Electronic gates define low, medium, and high GFP expression, reflecting low, medium, and high expression of the co-transfected SOS1cat plasmid. CD69 expression was analyzed in histograms for the three different gates. See Figure S21B for protein expression levels. 2C is a representative example of three independent experiments.

