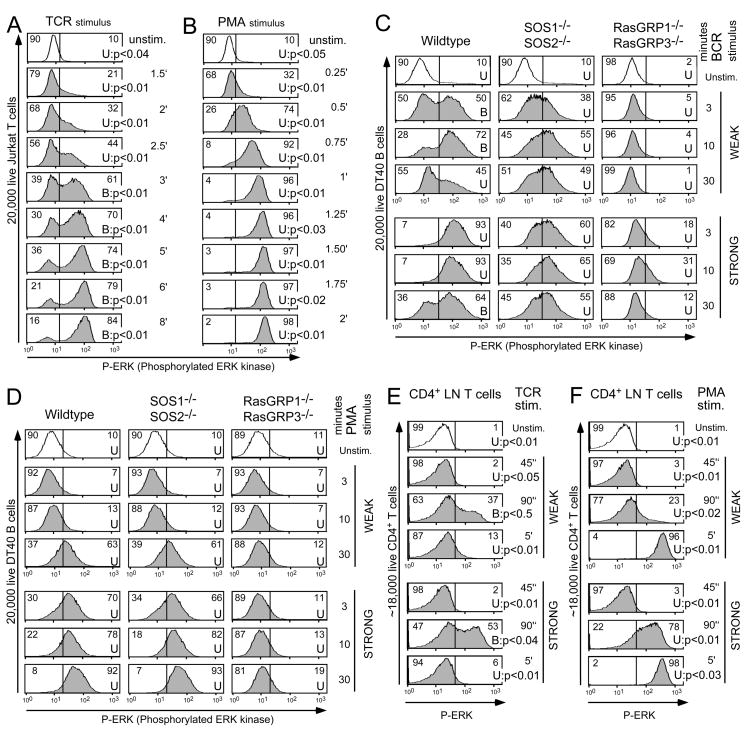
Figure 5. RasGRP induces analog phospho-ERK signals, whilst SOS induces digital signals in B cell lines and primary T cells.
(A) Fluorescence flow cytometric analysis of ERK phosphorylation in 20,000 individual Jurkat T cells per histogram. Cells were stimulated for the indicated time intervals with a TCR stimulating antibody (1:500 dilution of C305). ERK phosphorylation initially occurs in a unimodal fashion and switches to a bimodal pattern (Hartigan’s tests). Numbers inside the histograms represent the percentage of cells on either side of the divider.
(B) As in (A) but cells were stimulated with 25 ng/ml PMA (a DAG analog) for shorter time intervals. Note the gradual increase of phospho-ERK over time without bimodal patterns.
(C) The indicated DT40 B cell lines were weakly or strongly stimulated through their BCR for 3, 10, or 30 minutes, or left unstimulated. “U” or “B” labels indicate unimodal or bimodal (Hartigan test). See figure S24 for methods, additional data and p-values.
(D) Same as in (C), except cells were stimulated with PMA; either weak (10 ng/ml) or strong (60 ng/ml). See figure S25 for additional data.
(E, F) Digital, TCR-induced, ERK phosphorylation in CD4 positive lymph node T cells, but analog PMA-induced ERK phosphorylation. Cells were stimulated by crosslinking their TCR in (E) or by PMA in (F). Figures 5A-F are representative examples of 2, 3, 3, 2, 3, and 2 independent experiments, respectively.

