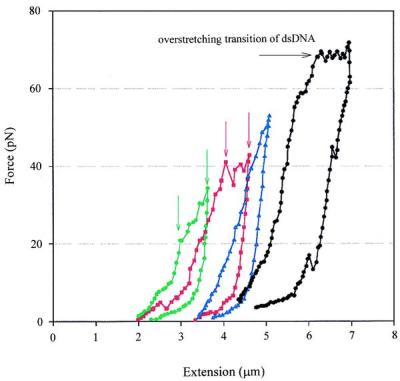
Figure 3.

Force-induced irreversible changes in chromatin fibers successively extended to increasing forces well above 20 pN in 5 mM NaCl, 10 mM Tris (pH 7.5), 2 mM EDTA, 2 mg/ml BSA. Hysteresis between the stretch and release part of the curve is evident in all curves. During the first stretch-release cycle (green) the fiber undergoes a transition that appears between 20 and 35 pN (between the green vertical arrows). In the successive cycles this transition occurs at higher forces (red curve and red vertical arrows) and eventually become less noticeable (blue curve). When the fiber is stretched up to ≈65 pN, a plateau corresponding to the overstretching of dsDNA can be seen (black curve and horizontal arrow).
