Abstract
The three-dimensional intrahippocampal distribution of axon collaterals of an in vivo filled CA3c pyramidal cell was investigated. The neuron was filled with biocytin in an anesthetized rat and the collaterals were reconstructed with the aid of a NeuroLucida program from 48 coronal sections. The total length of the axon collaterals exceeded 0.5 m, with almost 40,000 synaptic boutons. The majority of the collaterals were present in the CA1 region (70.0%), whereas 27.6% constituted CA3 recurrent collaterals with the remaining minority of axons returning to the dentate gyrus. The axon arbor covered more than two thirds of the longitudinal axis of the hippocampus, and the terminals were randomly distributed both locally and distally from the soma. We suggest that the CA3 system can be conceptualized as a single-module, in which nearby and distant targets are contacted by the same probability (similar to a mathematically defined random graph). This arrangement, in combination with the parallel input granule cells and parallel output CA1 pyramidal cells, appears ideal for segregation and integration of information and memories.
Introduction
The CA3 region of the hippocampus is a critical structure in the generation and maintenance of several hippocampal physiological and pathological patterns (McNaughton and Morris 1987; Treves and Rolls 1994), including gamma oscillations (Csicsvári et al. 2003) and initiation of sharp waves and interictal spikes (Buzsáki 1986; Buzsáki et al. 1983; Miles and Wong 1983; Wong and Traub 1983). CA3 pyramidal neurons give rise to extensive axon collaterals that project to both CA3 and CA1 regions, and the synapses they form represent the overwhelming majority of intrahippocampal connections (Amaral and Witter 1989). Most anatomical information about the intrahippocampal connectivity derives from bulk injection studies using anterograde and retrograde tracers. Several previous studies both in vitro and in vivo used intracellular markers to explore the axon patterns of hippocampal neurons (Finch et al. 1983; Ishizuka et al. 1990; Li et al. 1994; Sík et al. 1993; Tamamaki et al. 1988). In most of these earlier studies, axon collaterals were only partially labeled. Even in cases of in vivo single-cell labeling, the axon pattern reconstruction with the aid of camera lucida provided only qualitative data (Li et al. 1994; Sík et al. 1993). Understanding the mechanisms of axon growth, spatial distribution of terminals, the rules of arborization and to provide quantitative information for modeling studies requires a quantitative objective description and analysis of axon features. Progress in this area of research has been hampered mostly by the labor intensive data entry of microscopic data to computerized programs. However, given the importance of providing quantitative data on the entire axon tree of neurons in situ, we reconstructed a well-filled CA3 neuron. The most salient aspects of the axonal arbor are provided below and the data base is available for further analysis and insight by others (ftp.cogpsyphy.hu/wittner/D256_CA3-PC.asc).
Methods
Intracellular recording and labeling of CA3 pyramidal cells
Sprague–Dawley rats (Hilltop Labs, Scottsdale, PA, USA) were anesthetized with urethane (1.5 g/kg; Sigma) and placed in a stereotaxic apparatus. The body temperature of the rat was kept constant by a small animal thermoregulation device. The scalp was removed and a small (1.2 mm × 1.2 mm) bone window was drilled above the hippocampus (centered at AP = −3.5 and L = 2.5 mm from bregma, Paxinos and Watson 1982) for extra- and intracellular recordings. In addition, two bipolar Ni-chrome stimulating electrodes were implanted to activate input pathways to area CA3. One electrode was placed in the contralateral commissural pathway (AP = −1.3, ML = 1.0, depth = 4.0) and the other placed in the ipsilateral perforant path (AP = −7.1, ML = 3.75, depth = 4.0). Once the intracellular electrode and extracellular probe tip was placed in the brain, the bone window was covered by a mixture of paraffin (50%) and paraffin oil (50%) to prevent drying of the brain and decrease pulsation. The extracellular probe was advanced into the hilar/CA3 region and then the intracellular micropipette was advanced into the CA3 pyramidal layer and a cell was impaled. After the completion of the intracellular physiological data collection for another experiment, biocytin was injected through a bridge circuit using 500 ms depolarizing pulses at 0.6–2 nA at 1 Hz for about 60 min. Neuronal activity was followed throughout the procedure and the current was reduced if the electrode was blocked and/or the condition of the neuron deteriorated. All animal procedures were in compliance with PHS policy on Humane Care and Use of Laboratory Animals (Office of Laboratory Animal Welfare, National Institutes of Health) and the Guide for the Care and Use of Laboratory Animals (National Research Council, Washington, DC, USA) and approved by the Rutgers University Animal Care and Facilities Committee.
Histological analysis
Approximately 2 h after the biocytin injection, the animal was perfused intracardially with physiological saline followed by 300 ml fixative containing 4% paraformaldehyde, 0.05% glutaraldehyde and 0.2% picric acid in 0.1 M phosphate buffer (PB). The brain was then removed and postfixed in the same solution overnight. Coronal sections (70 μm thick) were cut from the dorsal hippocampus on a Vibroslice, washed with 0.1 M PB, then cryoprotected in 30% sucrose in 0.1 M PB overnight, and freeze-thawed three times over liquid nitrogen. After extensive washes with 0.1 M PB sections were incubated in avidin–biotin horseradish peroxidase complex (ABC, 1:200, Vector Laboratories, Burlingame, CA, USA) for 1.5 h. Biocytin labeling was visualized by ammonium nickel sulfate-intensified 3,3′-diaminobenzidine-4HCl (DAB, Sigma, St Louis, MO, USA), as a chromogene. Sections were mounted on gelatin coated slides and covered with DePeX. Data deriving from the same cell were included in our previous study (Wittner et al. 2006).
Analysis of the axonal reconstruction
The NeuroLucida 3.1 program was used for the serial reconstruction of in vivo intracellularly labeled single CA3 pyramidal cell from 48 consecutive sections (Wittner et al. 2006) over a 4-month period. The reconstruction was made at 100× magnification. Since we used the same tissue processing method, we applied the shrinkage correction factor 1.33 in the X and Y direction, determined by Turner et al. (1995). Briefly, it was determined by introducing four 100-μm-diameter tungsten microelectrode (2 mm × 2 mm in lateral and antero-posterior directions) using stereotaxic coordinates. The rat was perfused, and after tissue processing the middle of the tracks at the same depth in the hippocampus was determined, and the distances were measured. Correction factor for the shrinkage of the tissue in the Z direction was determined by measuring the section thickness at ten distinct points of ten randomly chosen sections. The known thickness of the sections (cut at 70 μm) was divided by the average of this measurement, which gave a correction factor of 5.82.
Results
In vivo intracellularly filled CA3 pyramidal neurons (n = 34) were inspected for the extent of their axon arbors. Of this larger series, a single CA3 neuron with extensive axon collaterals and low background was selected for reconstruction. The resting potential of the chosen cell was between −55 and −60 mV with an input resistance of 81.6 Mohm. The action potential was overshooting (i.e., crossed 0 mV). The membrane time constant measured from the −0.2 nA step was well fit with a single exponential with a time constant of 29.6 ms (Fig. 1). The CA3 pyramidal cell was spontaneously firing in single action potentials (Fig. 1e), and showed a hyperpolarization in response to sharp wave burst, simultaneously recorded with an extracellular electrode in the vicinity of the cell. In response to depolarizing currents pulses the cell usually responded with a short burst of action potentials and a large slow afterhyperpolarization (Fig. 1a). Antidromic activation of the CA3 pyramidal cell by stimulating the contralateral commissure elicited unit discharges of similar form at short latency (approximately 2 ms, Fig. 1c). Ipsilateral perforant path stimulation usually resulted in mixed excitation and inhibition of the CA3 pyramidal cell. After a ∼30 ms hyperpolarization the cell generated single action potentials or in some cases bursts of action potentials (Fig. 1d).
Fig. 1.
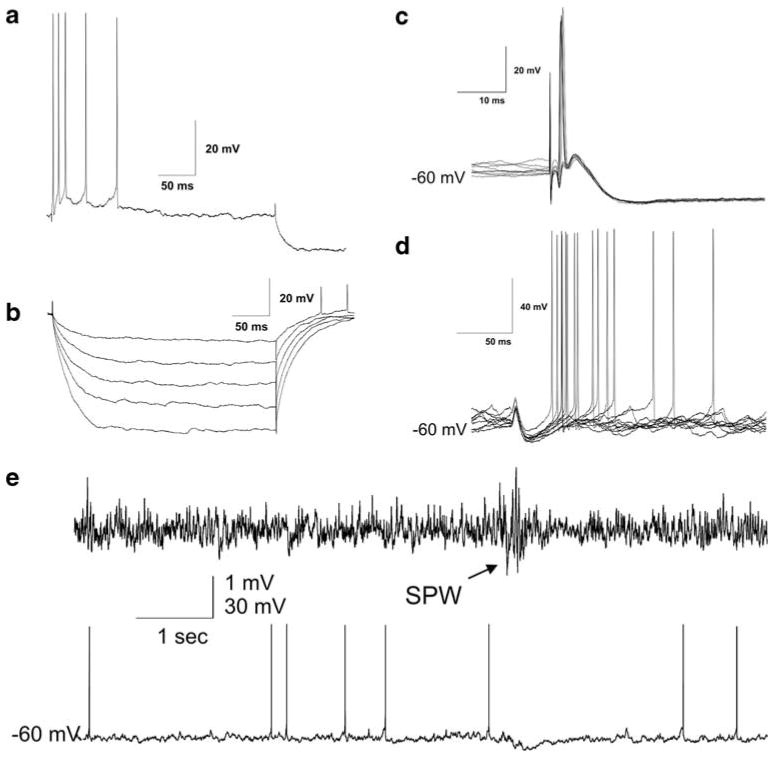
Physiological properties of the reconstructed CA3 pyramidal cell. a The neuron responds to a depolarizing current injection with a short burst of action potentials and a strong slow afterhyperpolarization. b Average response to hyperpolarizing current injections (three sweeps per step from −0.2 to −1.0 nA). c Contralateral commissural stimulation results in antidromic activation of the CA3 pyramidal cell at approximately 2 ms. Nine sweeps are overlaid. d Ipsilateral perforant path stimulation results in mixed excitation and inhibition of the CA3 pyramidal cell. Nine sweeps are overlaid. e The CA3 pyramidal cell is inhibited during a sharp wave (SPW) burst (arrow). The upper trace is the extracellular trace recorded near the CA3 pyramidal cell. The lower trace is the corresponding intracellular membrane potential over the same period of time in the pyramidal cell
The axon arborization of this intracellularly labeled cell was reconstructed with the aid of NeuroLucida program from 48 sections in the ipsilateral dorsal hippocampus. The cell body and dendrites were confined to the border of CA3c/CA3b region (Figs. 2a, 3) in the middle third of the antero-posterior axis of the hippocampus (Fig. 3c, d). We were able to reconstruct a long and complex axon arbor starting from the cell body (Fig. 4c), as well as a number of separate, short, branching or not branching axonal segments. In accordance with previous studies (Ishizuka et al. 1990; Li et al. 1994), the majority of the axon collaterals were found in the CA1 and CA3 regions, covering more than two thirds of the longitudinal length of the hippocampus (Fig. 3c, d; see movie in Supplementary Material). As described earlier in similarly labeled CA3 neurons (Li et al. 1994), the main axon ramified close to the soma, and gave several main collaterals (Figs. 2b, c, 4c). The relatively thick main axon collaterals projected toward the CA1 region or the dentate gyrus as well as gave thinner collaterals that arborized in the CA3 region (Fig. 2c). The axon collaterals projecting to the CA1 region followed the curve of the pyramidal cell layer (Fig. 3b), and no collaterals were observed to cross the hippocampal fissure. Marking the main axon collaterals with different colors (Fig. 4), it became visible that these collaterals provide innervation for quite a large area, crossing region borders (Fig. 4a, b). Although the innervated field is considerable, note, that the overlap is partial. For example the yellow collateral was confined mainly to the CA3 and to a small extent to the neighboring CA1 region. The dark blue collateral projected mostly to the far CA1 region, whereas the red one returned to the dentate gyrus (Fig. 4a).
Fig. 2.
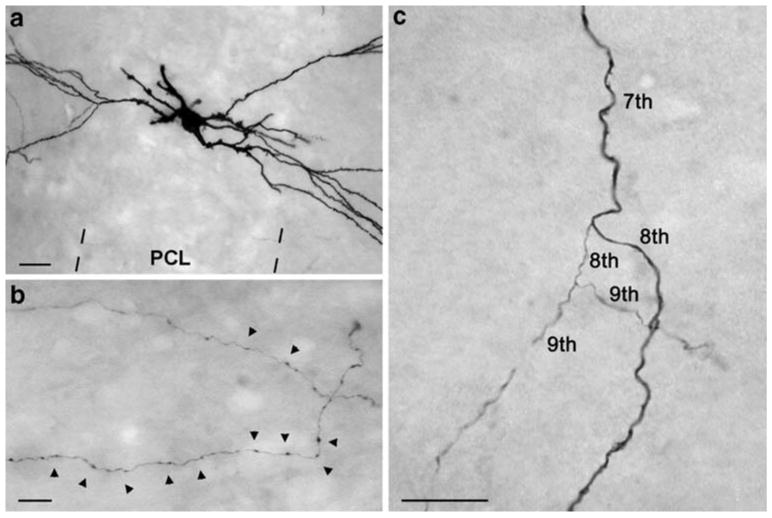
Light micrographs of the reconstructed CA3 pyramidal cell. a The cell body is situated at the CA3c/b border. b Light micrograph shows the well-filled boutons of the cell, located in the str. radiatum of the CA1 region. c The thick main axon collateral (7th and 8th order) emits thin local collaterals (8th and 9th order) in the str. radiatum of the CA3 region. PCL pyramidal cell layer. Scale bars a 20 μm, b and c 10 μm
Fig. 3.
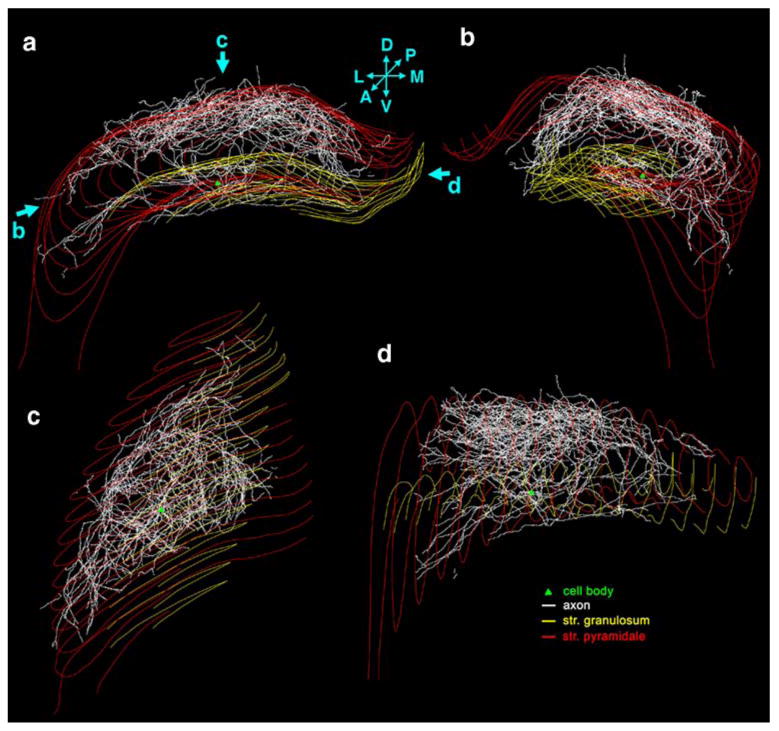
NeuroLucida reconstruction of the CA3 pyramidal cell. a Coronal view of the entire axon arbor. Green triangle shows the location of the cell body, the axons are white, the dentate granule cell layer is marked with yellow line, CA1-3 pyramidal cell layer with red line. D dorsal, V ventral, L lateral, M medial, A anterior, P posterior. b This rotated view shows that CA3 pyramidal cell axon collaterals follow the curve of the cornu Ammonis. c View of the axon arbor from dorsal. d View from medial
Fig. 4.
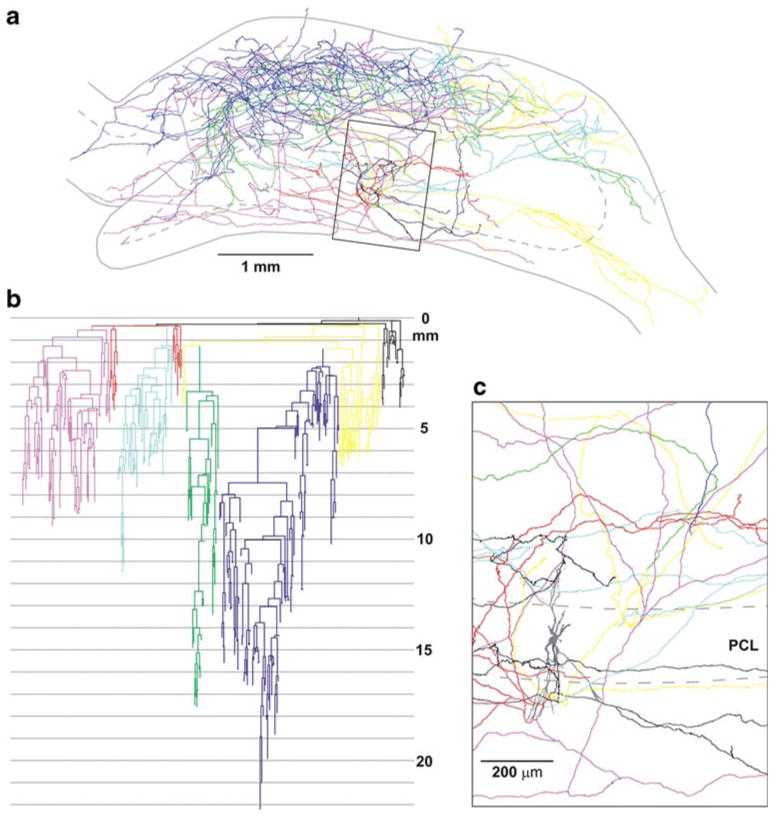
Color coded NeuroLucida drawing of the reconstructed axon arbor. a The main axon collaterals are marked with different colors, corresponding to the branches of the axogram (b). The outline of the hippocampus shows a section at the level of the cell body. b The axogram shows a strikingly ramifying axon arbor, with collateral routes as long as 22 mm. c The ramification system of the main collaterals with higher magnification. The cell body is marked with grey. PCL pyramidal cell layer. Scales a 1 mm, c 200 μm
The axogram (Fig. 4b) showed a strikingly complex branching pattern, with several collaterals covering a distance of approximately 22,000 μm from the soma. The total length of the reconstructed axon collaterals was 508,564 μm. The main axon arbor (shown on Fig. 4b) had a total length of 476,709 μm, whereas the total length of remaining axonal segments was 28,155 μm. The main axon arbor displayed 360 branching points with the closest being 128 μm and the farthest being 21,009 μm from the soma. Figure 5 shows the number of nodes relative to the distance from the cell body. The majority of the nodes were located within 10,000 μm of the cell body, and a second peak was present at about 15,000 μm. The axonal segment analysis of the main axon arbor demonstrates a very heavy ramification as evidenced by the observation that the cell displayed a considerable number of axonal segments of 10th to 20th order (Fig. 6a). By plotting the total length of axonal segments relative to their order, the distribution pattern seemed to be very similar to the number of axonal segments relative to their order (Fig. 6b). The average length of different order axonal segments appeared to be uniform (with large variance), with the exception of the first two segments (Fig. 6c).
Fig. 5.
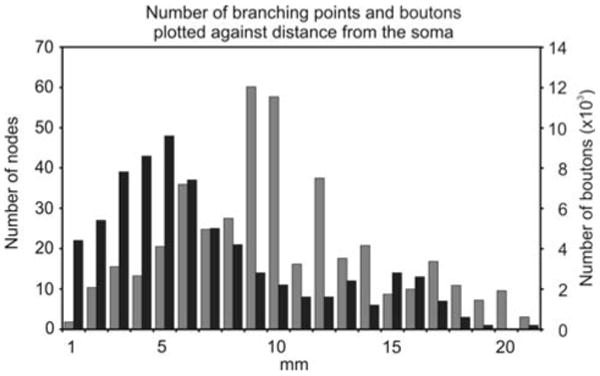
Distribution of the branching points (black) and the number of boutons (grey) as a function of distance from the cell body. Note two overlapping peaks, one at 5 mm and an other one at 15 mm. The peak in the bouton distribution might suggest the presence of long axonal segments at 10 mm from the soma
Fig. 6.
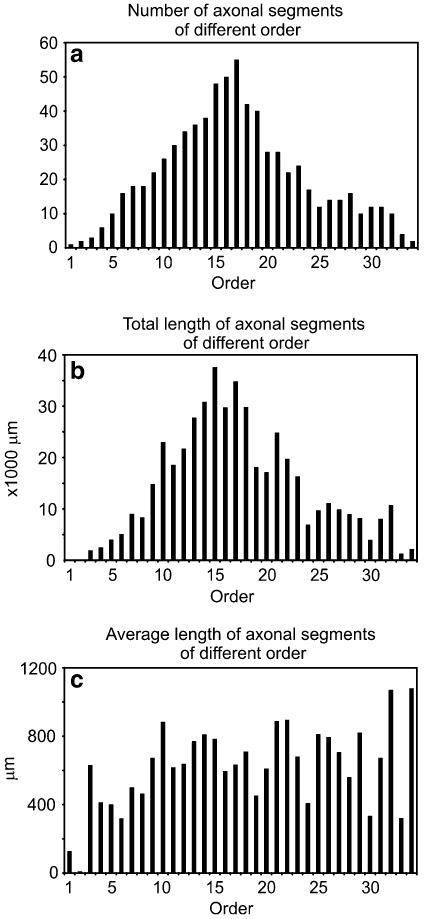
Analysis of axonal segments of different order. a Distribution plot showing the number of axonal segments of different order. b The total length of axonal segments of different order shows similar distribution to the number of axonal segments (a). c The average length of axonal segments of different order is uniform, except first and second order axonal segments
The total number of boutons was 39,215, giving rise to potentially the same number of synapses (Shepherd and Harris 1998; Sorra and Harris 1993; Wittner et al. 2006), with an average interbouton interval of 5.5 ± 4.3 μm (mean ± stdev). The majority of the axon terminals (70.0%) were located in the CA1 region, 27.6% in the CA3 region, while 2.4% of the boutons were found in the dentate gyrus (Table 1). The axon collaterals projecting to the dentate gyrus were mainly confined to the hilus, except two collaterals, one of which entered the granule cell layer of the lower blade, and the other traversed the str. granulosum and gave off several branches in the str. moleculare of the upper blade of the dentate gyrus. Although some clustering of the axon terminals were observed in association with the groupings of the branching points (Fig. 5), i.e., the density of the boutons showed a local increase around the nodes, the terminals were more or less similarly and unevenly distributed in both the vicinity of the cell body and at more distant layers, suggesting that the neuron may contact postsynaptic targets randomly. The large number of the boutons at ∼10 mm axon length from the soma without large numbers of nodes suggest the presence of long axonal segments. This observation is not contradictory with the observation that the average length of different order axonal segments is uniform, since the same order axonal segments can be located at different distances from the cell body.
Table 1.
Regional distribution of the axon terminals of a single CA3 pyramidal cell
| Region | Layer | Number of axon terminals | Proportion relative to the total number of terminals (%) |
|---|---|---|---|
| Dentate gyrus | hilus | 857 | 2.2 |
| str. granulosum | 34 | 0.1 | |
| str. moleculare | 44 | 0.1 | |
| Total | 935 | 2.4 | |
| CA3 | str. oriens | 3,122 | 8.0 |
| str. pyramidale | 491 | 1.2 | |
| str. radiatum | 6,070 | 15.5 | |
| str. lacunosum-moleculare | 1,158 | 3.0 | |
| Total | 10,841 | 27.6 | |
| CA1 | str. oriens | 809 | 2.0 |
| str. pyramidale | 661 | 1.7 | |
| str. radiatum | 25,848 | 65.9 | |
| str. lacunosum-moleculare | 121 | 0.3 | |
| Total | 27,439 | 70.0 |
In agreement with previous studies (Ishizuka et al. 1990; Li et al. 1994; Wittner et al. 2006), most of the boutons were present in the str. radiatum and str. oriens of the cornu Ammonis, but notable differences were found between the CA3 and the CA1 region. In the CA3 region 56.0% of the terminals were in the str. radiatum and 28.8% in the oriens, of the collaterals projecting toward the CA1 region only 10.7% were in the str. lacunosum-moleculare, and only 4.5% of the collaterals were observed to traverse the CA3 str. pyramidale. Most of the CA3 projections were present septally from the cell body. In contrast, in the CA1 region, the overwhelming majority of the axon collaterals (94.2%) was found in the str. radiatum, only 3.0% in str. oriens, 0.4% in the lacunosum-moleculare and 2.4% in the str. pyramidale. The distribution of axon terminals along the antero-posterior axis of the hippocampus was inhomogeneous (Fig. 7). In contrast to the mainly septally projecting CA3-bound collaterals, most axon branches in the CA1 region were emitted caudal to the cell body. The relatively few collaterals that returned to the dentate hilus were more symmetrically distributed in the septo-temporal axis, relative to the cell body (Fig. 7).
Fig. 7.
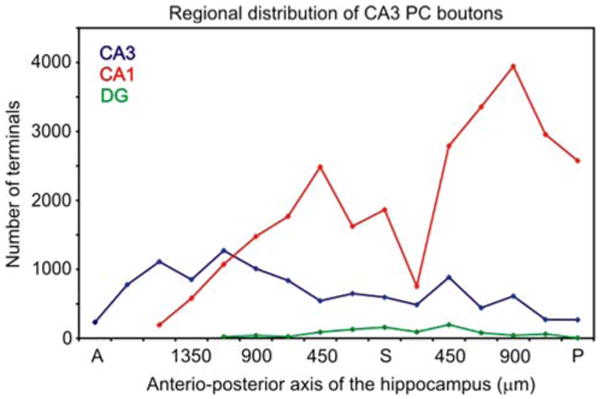
Inhomogeneous distribution of CA3 pyramidal cell boutons along the antero-posterior axis of the hippocampus. Boutons in the CA3 region (blue) are more numerous anterior to the cell body, whereas boutons in the CA1 region (red) are located mostly posterior to the cell body. The projection to the dentate gyrus (green) is symmetric. A anterior, P posterior, S soma
The number of axon terminals and arbors came to a relatively abrupt halt in the caudal direction. However, it remained ambiguous whether this reflected the true in vivo pattern of the axon arbor of the neuron or the staining in the more caudal sections were not sufficient for the identification of more caudally directed fibers. The complete reconstruction of the neuron is available in NeuroLucida format for further quantification and modeling studies (ftp.cogpsyphy.hu/wittner/D256_CA3-PC.asc). Three video files are also available which show the rotating reconstructed axon arbor (ftp.cogpsyphy.hu/wittner/D256_slow.avi; D256_medium.avi; D256_quick.avi).
Discussion
We have provided a quantitative description of the axon arbor of an in vivo filled CA3 pyramidal cell. Although some previous studies have also presented three-dimensional layouts of CA3 axon collaterals (Finch et al. 1983; Li et al. 1994; Sík et al. 1993), most cells in those studies were only partially labeled and only qualitative information was available from the camera lucida drawings. Our reconstruction provides the first quantitative data on an in vivo filled hippocampal neuron.
The CA3 region is considered to be a critical part of the hippocampal formation because of its hypothesized involvement in memory storage and retrieval (Hasselmo et al. 2002; Squire 1992; Treves and Rolls 1994). CA3-derived excitatory terminals make up more than 80% of all intrahippocampal synapses (Amaral and Witter 1989) and the recurrent collaterals are responsible for generating a variety of hippocampal population patterns (Buhl and Buzsáki 2005; Buzsáki et al. 1992; Buzsáki et al. 1983; Konopacki et al. 1988). However, the CA3 region is not homogeneous. Although excitatory recurrent collaterals are considered to be the hallmark of the CA3 region, the share of recurrent collaterals varies systematically in the CA3a-b-c axis. Whereas most axon collaterals of CA3a and the more distant CA3b neurons give rise to extensive recurrent collaterals that are confined to the CA3 region, pyramidal cells in the CA3c subarea are mostly projection neurons, with most collaterals destined to the CA1 region (Ishizuka et al. 1990; Li et al. 1994). In agreement with these previous reports, the majority of the collaterals of our reconstructed CA3c/b neuron was found in the CA1 region. In addition, a small fraction of collaterals returned to the dentate gyrus, including the granule cell layer and str. moleculare (Li et al. 1994). The analysis of the main collaterals of all the neurons examined (including the reconstructed cell) showed that typically more than one collateral projects to any of the target regions and with overlapping projection fields. One can only speculate about the significance of this novel finding. Multiple routes to the same target population and/or potential convergence on the same set of neurons is an indication of parallel, convergent excitation. It may also be regarded as a safety mechanism in case of axon collateral damage in disease. These mechanisms assume that the action potential, generated at the axon initial segment, invades the total axon arbor and induce neurotransmitter release at each of the 40,000 boutons. Alternatively, the action potential propagation in individual main axons may be affected by mechanisms such as ephaptic effects (for review see Jefferys 1995), branch point failures (Grossman et al. 1979; Luscher and Shiner 1990a, b) or modulation of ion channel activity, in which case this arrangement could constitute the basis for a differential regulation of CA3 activity distribution in the various hippocampal regions and subareas.
The modular organization of the hippocampus has long been debated (Amaral and Witter 1989; Andersen et al. 1969, 2000; Hampson et al. 1999; Redish et al. 2000). In agreement with previous two-dimensional reconstruction of CA2-3 cells (Ishizuka et al. 1990; Li et al. 1994; Tamamaki et al. 1988), we did not observe any systematic patterning of the axon arbors along the longitudinal axis of the hippocampus. Instead, the terminals were distributed relatively homogeneously and covered more than two thirds of the length of the hippocampus. Similar observations have been reported on in vivo filled mossy cells of the dentate gyrus (Buckmaster et al. 1996). The extensive homogenous bouton distribution with the convergence of the main axon collaterals suggests that CA3 neurons can contact nearby and more distantly located target CA3 and CA1 neurons with more or less the same probability. This constant probability of connection between CA3 pyramidal cells implies that the entire CA3 system can be viewed as a strongly connected random graph (Muller et al. 1996), an ideal substrate for forming random connections necessary for episodic memory (Kanerva 1988).
The homogeneity of the bouton distribution with the random probability of connections supports the hypothesis that the hippocampus could be conceptualized as a giant single-module (Fig. 8). The most important entry point to this hippocampal module is the granule cells of the dentate gyrus (“input layer”), characterized by high density, sparse parallel connections to the CA3 targets and no recurrent excitation among granule cells. Similarly, there is very little recurrent excitation present among the members of the output layer (CA1 pyramidal cells). Sandwiched between these two parallel systems lies the large CA3 recurrent-associational system (“hidden layer”) with an estimated five to ten billion random synaptic connections (using an estimated 250,000 CA3 pyramidal cells). Computational structures with these features are expected to perform sequential pattern segregation and pattern integration, the two critical ingredients of memory storage and recall (Lőrincz and Buzsáki 2000; Treves and Rolls 1994). These conceptualized operations are segregated also by anatomical space. The dentate gyrus is thought to perform pattern segregation, serving to distinguish between places/objects/situations with overlapping features, whereas the CA3 region would do pattern integration, i.e., maintaining stable representation reconstructed from fragmentary input information. Together with the “novelty detector” CA1 region, the hippocampus is an ideal region for cognitive mapping and storing and recalling episodic memories (for review see: Martin and Clark 2007; McNaughton et al. 2006).
Fig. 8.
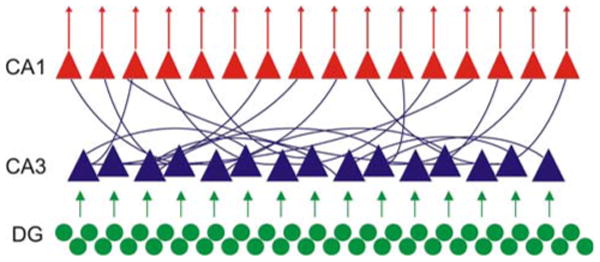
The CA fields of the hippocampus form a random graph. The dentate gyrus (green)—as input region of the hippocampus—gives local parallel connections to the CA3 region. The CA3 region (blue), beside forwarding the information to the CA1 region, makes a considerable recurrent excitation with its highly connected axonal system. The output CA1 region (red) also shows local parallel connections
Supplementary Material
The online version of this article (doi:10.1007/s00429-007-0148-y) contains supplementary material, which is available to authorized users.
Acknowledgments
This research was supported by NIH (MH54671 to GB and NSO23945 to LZ). We would like to thank Alvaro Duque for support and teaching the use of NeuroLucida.
Contributor Information
Lucia Wittner, Center for Molecular and Behavioral Neuroscience, Rutgers, The State University of New Jersey, 197 University Avenue, Newark, NJ 07102, USA; Institute of Experimental Medicine, Hungarian Academy of Sciences, Budapest, Hungary; Institute for Psychology, Hungarian Academy of Sciences, Budapest, Hungary.
Darrell A. Henze, Center for Molecular and Behavioral Neuroscience, Rutgers, The State University of New Jersey, 197 University Avenue, Newark, NJ 07102, USA
László Záborszky, Center for Molecular and Behavioral Neuroscience, Rutgers, The State University of New Jersey, 197 University Avenue, Newark, NJ 07102, USA.
György Buzsáki, Center for Molecular and Behavioral Neuroscience, Rutgers, The State University of New Jersey, 197 University Avenue, Newark, NJ 07102, USA.
References
- Amaral DG, Witter MP. The three-dimensional organization of the hippocampal formation: a review of anatomical data. Neuroscience. 1989;31:571–591. doi: 10.1016/0306-4522(89)90424-7. [DOI] [PubMed] [Google Scholar]
- Andersen P, Bliss TV, Lomo T, Olsen LI, Skrede KK. Lamellar organization of hippocampal excitatory pathways. Acta Physiol Scand. 1969;76:4A–5A. doi: 10.1111/j.1748-1716.1969.tb04499.x. [DOI] [PubMed] [Google Scholar]
- Andersen P, Soleng AF, Raastad M. The hippocampal lamella hypothesis revisited. Brain Res. 2000;886:165–171. doi: 10.1016/s0006-8993(00)02991-7. [DOI] [PubMed] [Google Scholar]
- Buckmaster PS, Wenzel HJ, Kunkel DD, Schwartzkroin PA. Axon arbors and synaptic connections of hippocampal mossy cells in the rat in vivo. J Comp Neurol. 1996;366:271–292. doi: 10.1002/(sici)1096-9861(19960304)366:2<270::aid-cne7>3.0.co;2-2. [DOI] [PubMed] [Google Scholar]
- Buhl DL, Buzsáki G. Developmental emergence of hippocampal fast-field “ripple” oscillations in the behaving rat pups. Neuroscience. 2005;134:1423–1430. doi: 10.1016/j.neuroscience.2005.05.030. [DOI] [PMC free article] [PubMed] [Google Scholar]
- Buzsáki G. Hippocampal sharp waves: their origin and significance. Brain Res. 1986;398:242–252. doi: 10.1016/0006-8993(86)91483-6. [DOI] [PubMed] [Google Scholar]
- Buzsáki G, Leung LW, Vanderwolf CH. Cellular bases of hippocampal EEG in the behaving rat. Brain Res. 1983;287:139–171. doi: 10.1016/0165-0173(83)90037-1. [DOI] [PubMed] [Google Scholar]
- Buzsáki G, Horvath Z, Urioste R, Hetke J, Wise K. High-frequency network oscillation in the hippocampus. Science. 1992;256:1025–1027. doi: 10.1126/science.1589772. [DOI] [PubMed] [Google Scholar]
- Csicsvári J, Jamieson B, Wise KD, Buzsáki G. Mechanisms of gamma oscillations in the hippocampus of the behaving rat. Neuron. 2003;37:311–322. doi: 10.1016/s0896-6273(02)01169-8. [DOI] [PubMed] [Google Scholar]
- Finch DM, Nowlin NL, Babb TL. Demonstration of axonal projections of neurons in the rat hippocampus and subiculum by intracellular injection of HRP. Brain Res. 1983;271:201–216. doi: 10.1016/0006-8993(83)90283-4. [DOI] [PubMed] [Google Scholar]
- Grossman Y, Parnas I, Spira ME. Differential conduction block in branches of a bifurcating axon. J Physiol. 1979;295:283–305. doi: 10.1113/jphysiol.1979.sp012969. [DOI] [PMC free article] [PubMed] [Google Scholar]
- Hampson RE, Simeral JD, Deadwyler SA. Distribution of spatial and nonspatial information in dorsal hippocampus. Nature. 1999;402:610–614. doi: 10.1038/45154. [DOI] [PubMed] [Google Scholar]
- Hasselmo ME, Bodelon C, Wyble BP. A proposed function for hippocampal theta rhythm: separate phases of encoding and retrieval enhance reversal of prior learning. Neural Comput. 2002;14:793–817. doi: 10.1162/089976602317318965. [DOI] [PubMed] [Google Scholar]
- Ishizuka N, Weber J, Amaral DG. Organization of intrahippocampal projections originating from CA3 pyramidal cells in the rat. J Comp Neurol. 1990;295:580–623. doi: 10.1002/cne.902950407. [DOI] [PubMed] [Google Scholar]
- Jefferys JG. Nonsynaptic modulation of neuronal activity in the brain: electric currents and extracellular ions. Physiol Rev. 1995;75:689–723. doi: 10.1152/physrev.1995.75.4.689. [DOI] [PubMed] [Google Scholar]
- Kanerva P. Sparse distributed memory. The MIT Press; Cambridge: 1988. [Google Scholar]
- Konopacki J, Bland BH, Roth SH. Carbachol-induced EEG ‘theta’ in hippocampal formation slices: evidence for a third generator of theta in CA3c area. Brain Res. 1988;451:33–42. doi: 10.1016/0006-8993(88)90746-9. [DOI] [PubMed] [Google Scholar]
- Li XG, Somogyi P, Ylinen A, Buzsáki G. The hippocampal CA3 network: an in vivo intracellular labeling study. J Comp Neurol. 1994;339:181–208. doi: 10.1002/cne.903390204. [DOI] [PubMed] [Google Scholar]
- Lőrincz A, Buzsáki G. Two-phase computational model training long-term memories in the entorhinal-hippocampal region. Ann N Y Acad Sci. 2000;911:83–111. doi: 10.1111/j.1749-6632.2000.tb06721.x. [DOI] [PubMed] [Google Scholar]
- Luscher HR, Shiner JS. Computation of action potential propagation and presynaptic bouton activation in terminal arborizations of different geometries. Biophys J. 1990a;58:1377–1388. doi: 10.1016/S0006-3495(90)82484-X. [DOI] [PMC free article] [PubMed] [Google Scholar]
- Luscher HR, Shiner JS. Simulation of action potential propagation in complex terminal arborizations. Biophys J. 1990b;58:1389–1399. doi: 10.1016/S0006-3495(90)82485-1. [DOI] [PMC free article] [PubMed] [Google Scholar]
- Martin SJ, Clark RE. The rodent hippocampus and spatial memory: from synapses to systems. Cell Mol Life Sci. 2007;64:401–431. doi: 10.1007/s00018-007-6336-3. [DOI] [PMC free article] [PubMed] [Google Scholar]
- McNaughton BL, Morris RGM. Hippocampal synaptic enhancement and information storage within a distributed memory system. Trends Neurosci. 1987;10:408–415. [Google Scholar]
- McNaughton BL, Battaglia FP, Jensen O, Moser EI, Moser MB. Path integration and the neural basis of the ‘cognitive map’. Nat Rev Neurosci. 2006;7:663–678. doi: 10.1038/nrn1932. [DOI] [PubMed] [Google Scholar]
- Miles R, Wong RK. Single neurones can initiate synchronized population discharge in the hippocampus. Nature. 1983;306:371–373. doi: 10.1038/306371a0. [DOI] [PubMed] [Google Scholar]
- Muller RU, Stead M, Pach J. The hippocampus as a cognitive graph. J Gen Physiol. 1996;107:663–694. doi: 10.1085/jgp.107.6.663. [DOI] [PMC free article] [PubMed] [Google Scholar]
- Paxinos G, Watson C. The rat brain in stereotaxic coordinates. Academic; Sidney: 1982. [DOI] [PubMed] [Google Scholar]
- Redish AD, Rosenzweig ES, Bohanick JD, McNaughton BL, Barnes CA. Dynamics of hippocampal ensemble activity realignment: time versus space. J Neurosci. 2000;20:9298–9309. doi: 10.1523/JNEUROSCI.20-24-09298.2000. [DOI] [PMC free article] [PubMed] [Google Scholar]
- Shepherd GM, Harris KM. Three-dimensional structure and composition of CA3 → CA1 axons in rat hippocampal slices: implications for presynaptic connectivity and compartmentalization. J Neurosci. 1998;18:8300–8310. doi: 10.1523/JNEUROSCI.18-20-08300.1998. [DOI] [PMC free article] [PubMed] [Google Scholar]
- Sík A, Tamamaki N, Freund TF. Complete axon arborization of a single CA3 pyramidal cell in the rat hippocampus, and its relationship with postsynaptic parvalbumin-containing interneurons. Eur J Neurosci. 1993;5:1719–1728. doi: 10.1111/j.1460-9568.1993.tb00239.x. [DOI] [PubMed] [Google Scholar]
- Sorra KE, Harris KM. Occurrence and three-dimensional structure of multiple synapses between individual radiatum axons and their target pyramidal cells in hippocampal area CA1. J Neurosci. 1993;13:3736–3748. doi: 10.1523/JNEUROSCI.13-09-03736.1993. [DOI] [PMC free article] [PubMed] [Google Scholar]
- Squire LR. Memory and the hippocampus–a synthesis from findings with rats, monkeys, and humans. Psychol Rev. 1992;99:195–231. doi: 10.1037/0033-295x.99.2.195. [DOI] [PubMed] [Google Scholar]
- Tamamaki N, Abe K, Nojyo Y. Three-dimensional analysis of the whole axonal arbors originating from single CA2 pyramidal neurons in the rat hippocampus with the aid of a computer graphic technique. Brain Res. 1988;452:255–272. doi: 10.1016/0006-8993(88)90030-3. [DOI] [PubMed] [Google Scholar]
- Treves A, Rolls ET. Computational analysis of the role of the hippocampus in memory. Hippocampus. 1994;4:374–391. doi: 10.1002/hipo.450040319. [DOI] [PubMed] [Google Scholar]
- Turner DA, Li XG, Pyapali GK, Ylinen A, Buzsáki G. Morphometric and electrical properties of reconstructed hippocampal CA3 neurons recorded in vivo. J Comp Neurol. 1995;356:580–594. doi: 10.1002/cne.903560408. [DOI] [PubMed] [Google Scholar]
- Wittner L, Henze DA, Záborszky L, Buzsáki G. Hippocampal CA3 pyramidal cells selectively innervate aspiny interneurons. Eur J Neurosci. 2006;24:1286–1298. doi: 10.1111/j.1460-9568.2006.04992.x. [DOI] [PubMed] [Google Scholar]
- Wong RK, Traub RD. Synchronized burst discharge in disinhibited hippocampal slice. I. Initiation in CA2-CA3 region. J Neurophysiol. 1983;49:442–458. doi: 10.1152/jn.1983.49.2.442. [DOI] [PubMed] [Google Scholar]
Associated Data
This section collects any data citations, data availability statements, or supplementary materials included in this article.
Supplementary Materials
The online version of this article (doi:10.1007/s00429-007-0148-y) contains supplementary material, which is available to authorized users.


