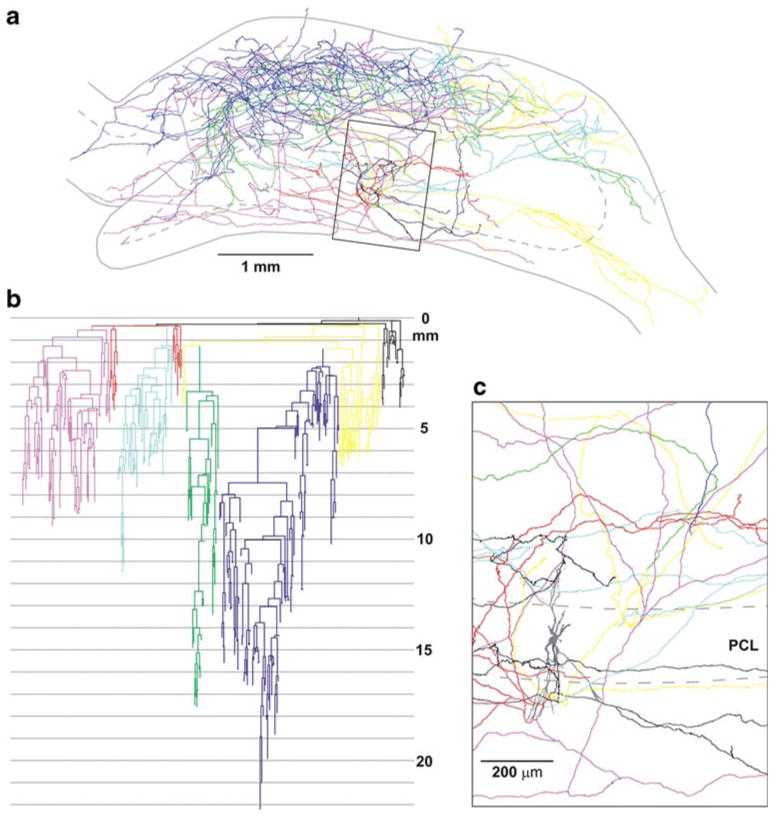
Fig. 4.

Color coded NeuroLucida drawing of the reconstructed axon arbor. a The main axon collaterals are marked with different colors, corresponding to the branches of the axogram (b). The outline of the hippocampus shows a section at the level of the cell body. b The axogram shows a strikingly ramifying axon arbor, with collateral routes as long as 22 mm. c The ramification system of the main collaterals with higher magnification. The cell body is marked with grey. PCL pyramidal cell layer. Scales a 1 mm, c 200 μm
