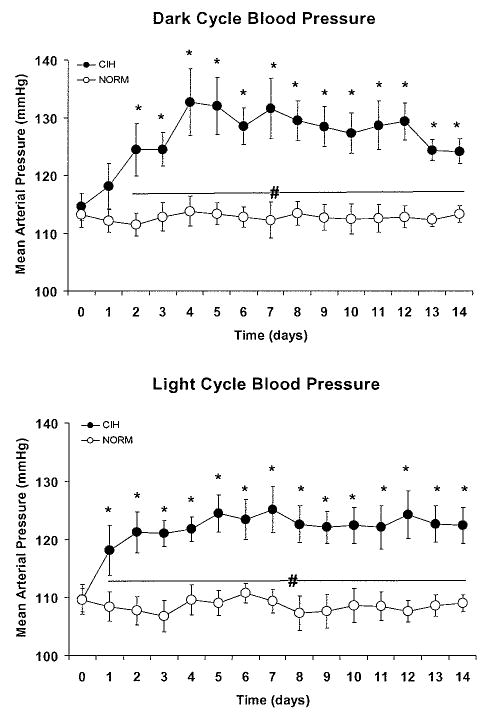
Figure 3.
For each day of the experimental protocol, we computed an average mean arterial pressure (MAP) during the 12-hour light cycle and the 12-hour dark cycle for each rat in the chronic intermittent hypoxia (CIH) and normoxic control (NORM) group. Then, daily group mean values for each cycle were calculated. Day 0 values are the means obtained during a 5-day normoxic baseline period. Exposure to CIH produced increases in MAP above baseline that were evident during the dark cycle (top panel), when intermittent hypoxic cycles occurred, and also during the light cycle (bottom panel), when the animals were unperturbed. *P<0.05 vs. baseline value, # P<0.05 for CIH vs. NORM.

