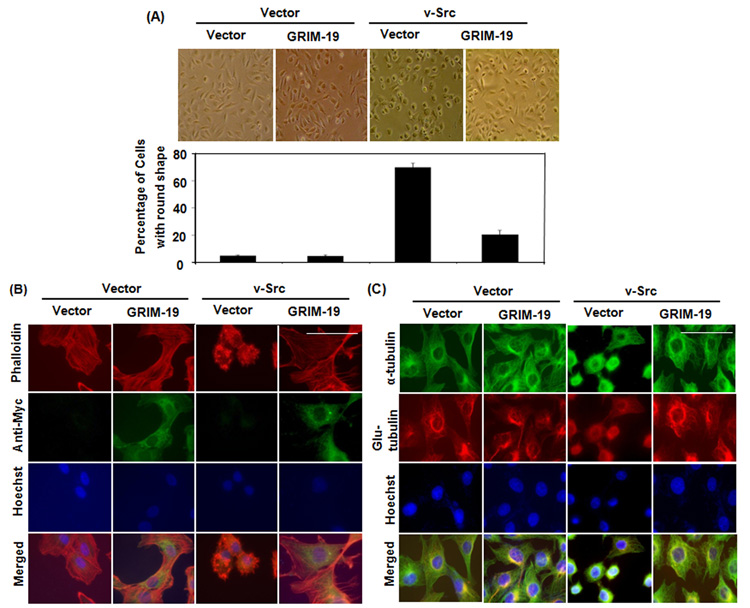
Fig. 1. GRIM-19 suppressed v-Src-induced morphologic changes and cytoskeleton remodeling.
(A) Phase contrast photomicrographs of 3Y1 cells expressing GRIM-19, v-Src, v-Src/GRIM-19 and control vector. The graph below show the percentage of cells with rounded morphology as quantified from various fields. Magnification: 10×. Mean percentages and SE were plotted. (B) Immunofluorescent images of cells expressing, control vector GRIM-19, v-Src, and v-Src/GRIM-19 showing actin network (Red), exogenous GRIM-19 (green) and nucleus (Blue). Magnification: 100×. Scale bar = 50µm (C) Immunofluorescent images of cells expressing control vector, GRIM-19, v-Src, and v-Src/GRIM-19 showing dynamic microtubules (green), stable microtubules (red) and nucleus (blue). Magnification: 100×. Scale bar = 50µm.

