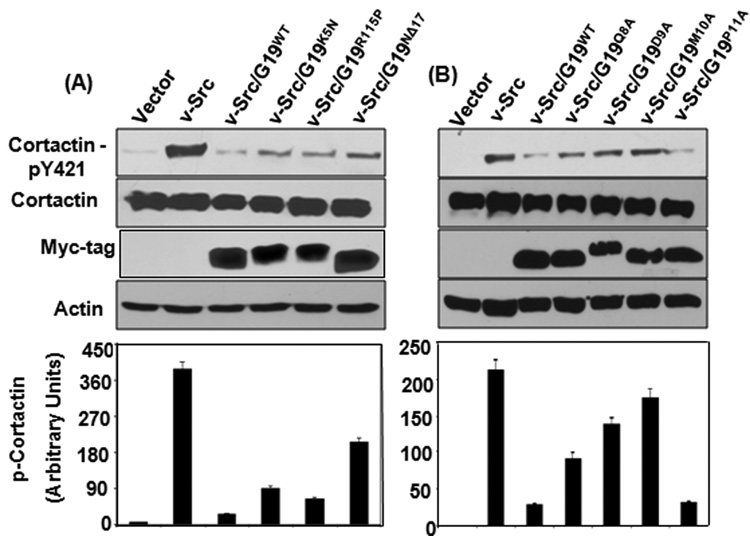
Fig. 4. Effect of GRIM-19 on v-Src-induced phosphorylation of cortactin.
(A&B) Representative Western blots of total and phosphorylated cortactin in v-Src-transformed 3Y1 cells co-expressing wildtype or mutant GRIM-19 proteins. A semi-quantitative representation of phosphorylated cortactin levels in the respective cell lines. The band intensity of phosphorylated cortactin was normalized using band intensity of total cortactin. Bar represents mean band intensity ±SE from 4 independent samples is shown in each case.

