Figure 5.
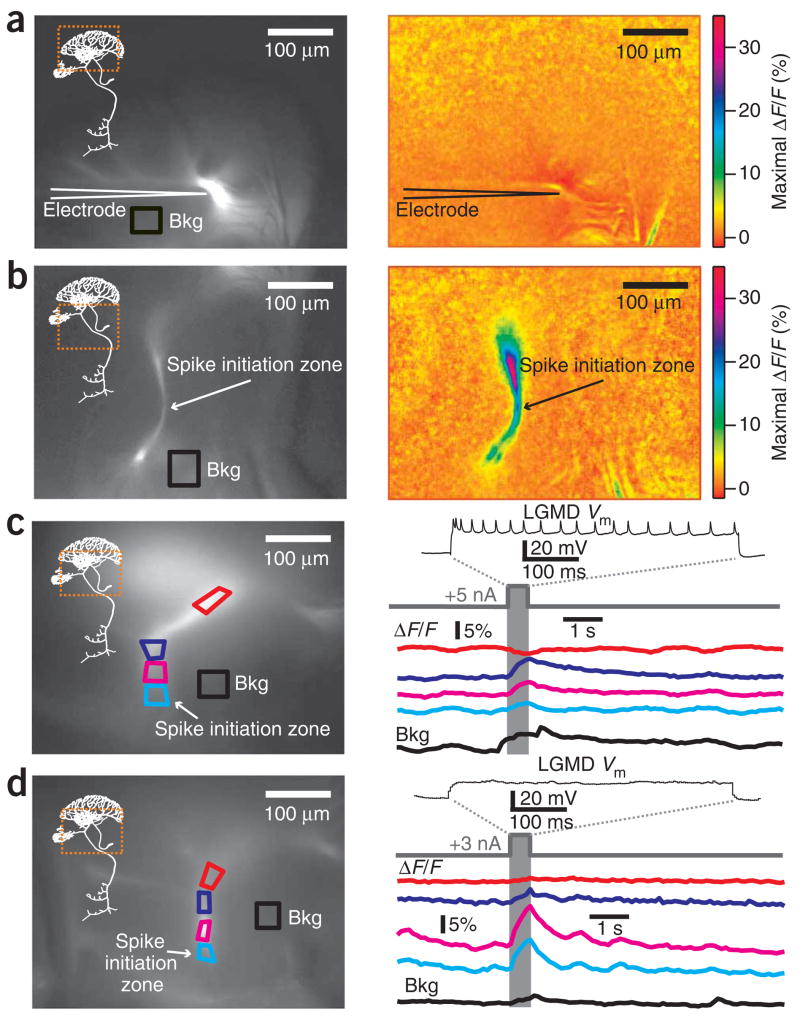
Calcium entry is confined to a region of the LGMD close to the spike initiation zone during depolarizing current injection. (a) Basal fluorescence image of the excitatory dendritic field (left) and maximal ΔF/F (right) in response to depolarizing current (500 ms, +9 nA). Bkg, region used for background subtraction. Dashed square (left panel) shows the LGMD region imaged in right panel. (b) Raw fluorescence image of the SIZ (left) and maximal ΔF/F (right) for the same neuron, penetration site and current shown in a. (c) Basal resting fluorescence image of a second LGMD neuron (left), with four regions of interest (ROIs) demarcated in different colors. Top trace (right), membrane potential (Vm) during a dendritic depolarizing current pulse (500 ms, +5 nA). Colored traces, time course of ΔF/F in the ROIs. Bottom trace, ΔF/F used for background subtraction. (d) Basal resting fluorescence image (left) and Vm response (right, top) in a third LGMD neuron during subthreshold dendritic current pulse (500 ms, +3 nA). The subsequent traces show ΔF/F in the ROIs indicated on the left. Calcium influx does not depend on action potential firing. Electrode is outside field of view in b–d.

