
Figure 2.
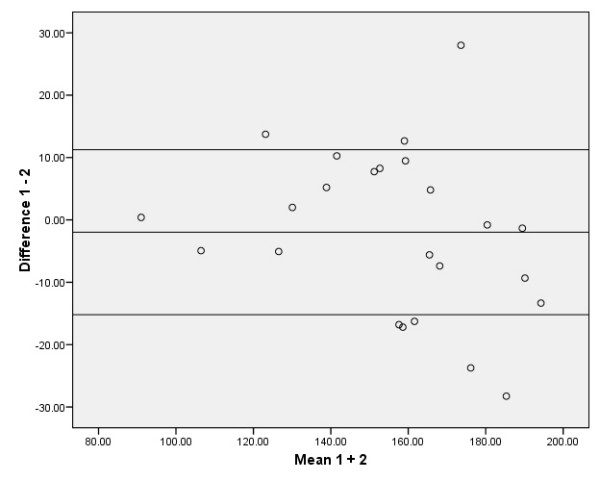
Distribution from Bland and Altman; average of 3 MVPT values for intra-observer measurements. Eight data points are outside the ± 1.96 standard deviation boundaries. The ± 1.96 standard deviation boundaries represent approximately 15.19 Nm below and 11.25 Nm above the mean, which is -1.97 Nm.