
Figure 3.
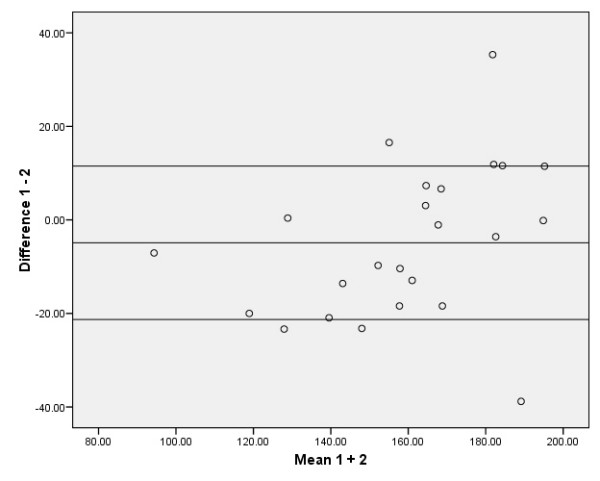
Distribution from Bland and Altman; average of 3 MVPT values for inter-observer measurements. Five data points are outside the ± 1.96 standard deviation boundaries. The ± 1.96 standard deviation boundaries represent approximately 21.29 Nm below and 11.51 Nm above the mean, which is -4.89 Nm.