
Figure 5.
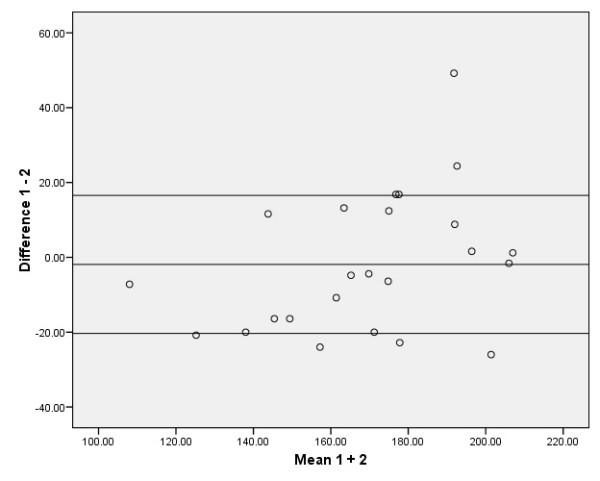
Distribution from Bland and Altman; single MVPT values for inter-observer measurements. Five data points are outside the ± 1.96 standard deviation boundaries. The ± 1.96 standard deviation boundaries represent approximately 20.36 Nm below and 16.56 Nm above the mean, which is -1.9 Nm.