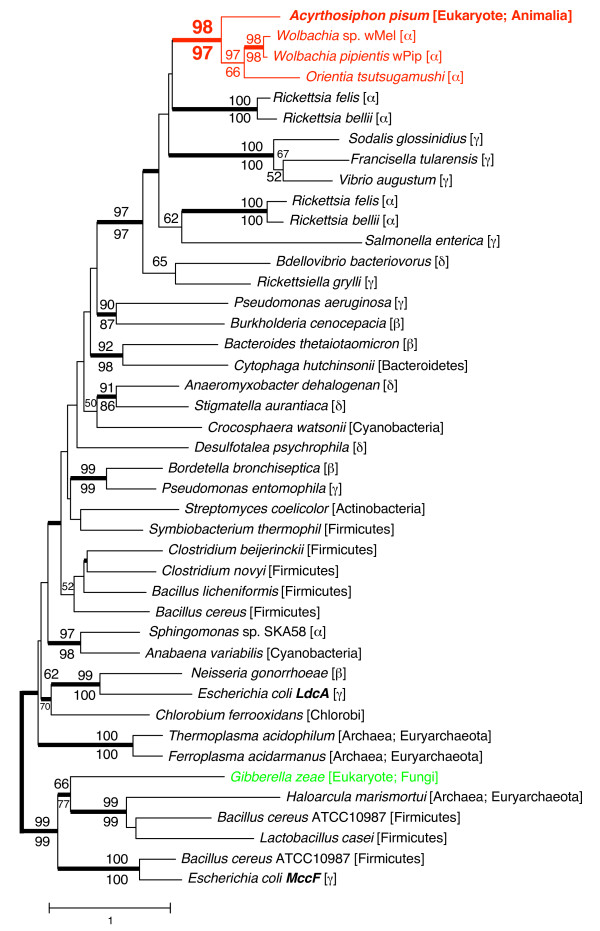
Figure 3.
Phylogenetic position of the aphid LdcA. A total of 246 aligned amino acid sites were subjected to the analysis. A neighbour-joining tree is shown, while the ML tree and BP tree exhibited substantially the same topologies. On each node, bootstrap support values over 50% are shown (NJ above, ML below). Thickened nodes indicate the Bayesian posterior probabilities are > 0.95. Taxonomic positions (eubacterial taxonomy unless otherwise stated) are shown in brackets. α, β, γ, and δ indicate proteobacterial classes. The A. pisum-Rickettsiales cluster is shown in red. The sequence from the fungus G. zeae is shown in green.

