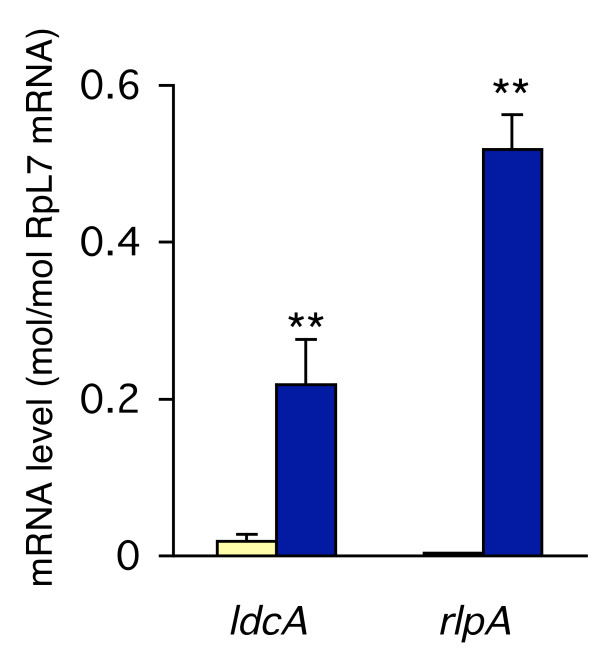
Figure 5.
Expression levels of ldcA and rlpA in the bacteriocyte. Ivory columns, expression levels in the whole body; blue columns, expression levels in the bacteriocyte; bars, standard errors (n = 6). The expression levels are shown in terms of mRNA copies of target genes per copy of mRNA for RpL7. Asterisks indicate statistically significant differences (Mann-Whitney U-test; **, p < 0.01).

