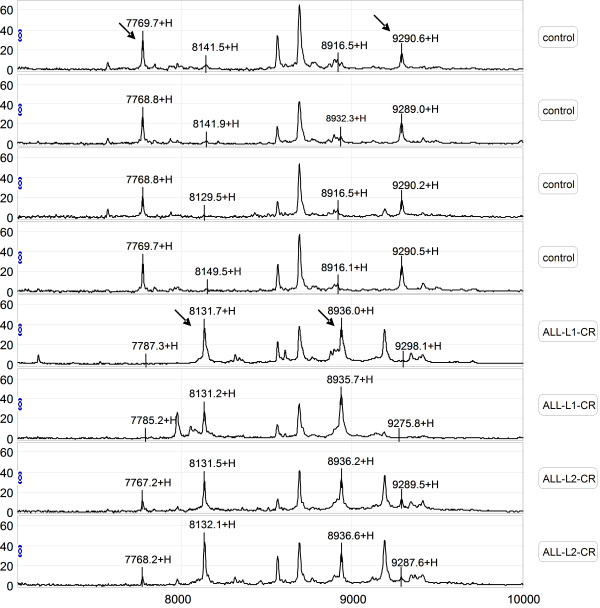
Figure 1.
Representative mapping of SELDI-TOF-MS analysis of sera from healthy controls and pediatric ALL patients. Differentially expressed proteins with potential diagnostic significance are indicated by arrows. The top group denotes serum from a healthy volunteer, in which 7769 m/z and 9290 m/z were up-regulated. The bottom group denotes sera from patients with ALL, in which 8137 m/z and 8937 m/z were over-expressed.

