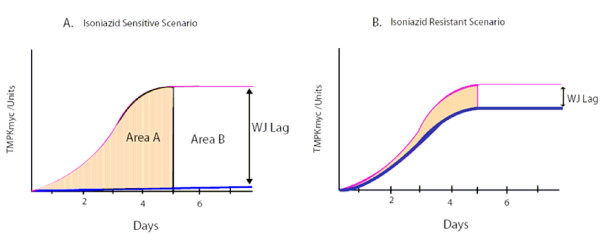
Figure 4.
Projected patterns of variation of TMKmyc curves in the drug sensitive and resistance scenario against a normal TMKmyc curve. This figure shows theorized patterns of variation for TMKmyc curves in the drug sensitive (A) and resistance (B) scenarios against a background normal TMKmyc curve. Note that, from this illustration, one could say that the extent of resistance (or number of mutant phenotypes) present in scenario B is the difference between the areas under both curves shaded light yellow. Note also that for any drug resistance profiling based on tmk assays, resistance may be viewed as inversely correlated to TMKmyc levels, while sensitivity is directly proportional to levels of TMK. The difference between TMKmyc levels of test versus standard TMKmyc curve is denoted by a window "wj" or wayengera-joloba lag, the numerical value of which is "WJ". Overall, drug sensitivity ~WJ and resistance ~1/WJ.

