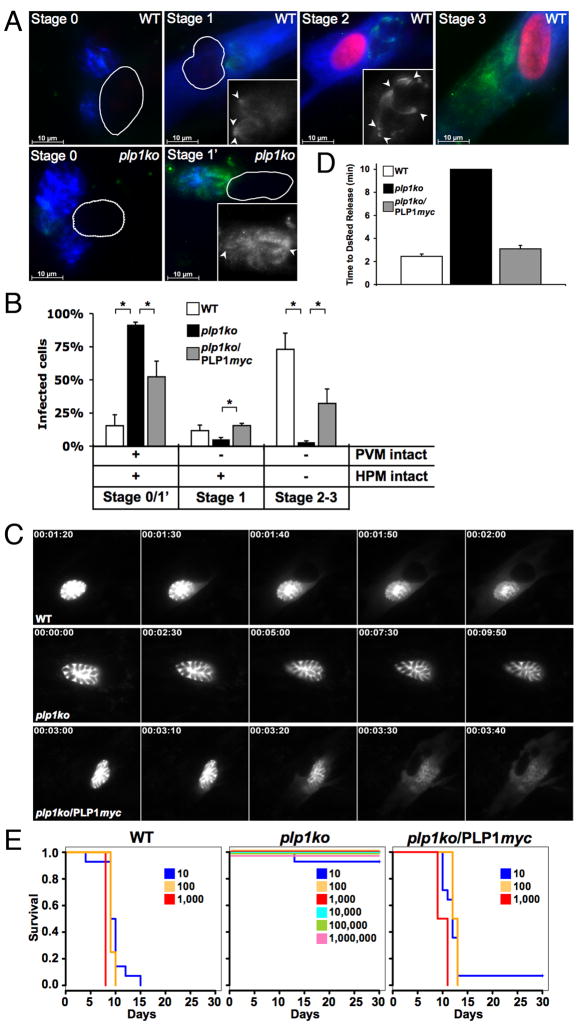
Figure 3.
Evidence of pore formation by TgPLP1 (A) Ionophore-induced permeabilization by immobilized WT or plp1ko tachyzoites. Stage 0: PV marker (GRA1, blue) remains contained within the PVM, no microneme release (SUB1, green), no labeling of host cell nucleus by PI, (red or outlined when unlabeled). Stage 1: Microneme contents have been secreted onto the parasite surface (green, see also inset; arrowhead = parasite apex), PV markers have diffused throughout the host cell but host cell nucleus remains unlabeled. Stage 2: Host nucleus is now PI positive, indicating permeabilization of the HPM. Stage 3: Microneme proteins have diffused throughout the host cytoplasm. Cells infected by plp1ko remain in stage 0 or display microneme secretion without PV marker release (stage 1′). (B) Quantification of induced PVM and HPM permeabilization for WT, plp1ko, or plp1ko/PLP1myc. Error bars are SEM (n = 6) and asterisk indicates P < 0.05 (Student’s t-test). (C) Rapid release of DsRed from the vacuole in WT (top) and plp1ko/PLP1myc (bottom), but not plp1ko (middle). Time stamp (h:min:sec) indicates time following calcium ionophore addition. (D) Average time to DsRed release within a 10min observation period. Error bars are SEM (n ≥ 30). (E) Virulence in outbred mice following inoculation of escalating tachyzoite numbers.

