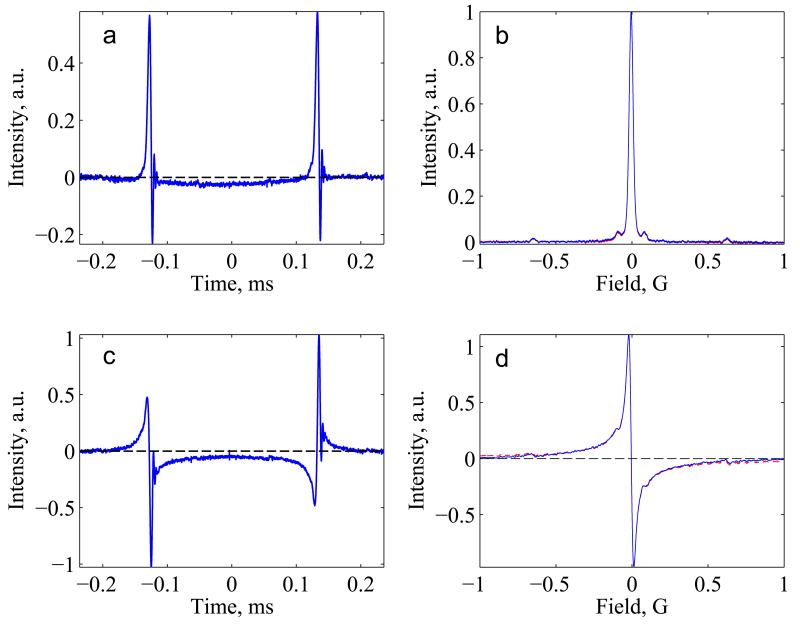
Figure 5.
Absorption and dispersion rapid-scan signals for trityl-CD3 (a,c), that show the deviation of the baseline from a constant (dashed) line. Deconvolution followed by the background removal procedure gave the blue (solid) lines (b,d). Subtraction of an off-resonance background trace gave the red (dashed) lines (b,d), which is nearly superimposable on the trace obtained by the background removal procedure.

