
Figure 4.
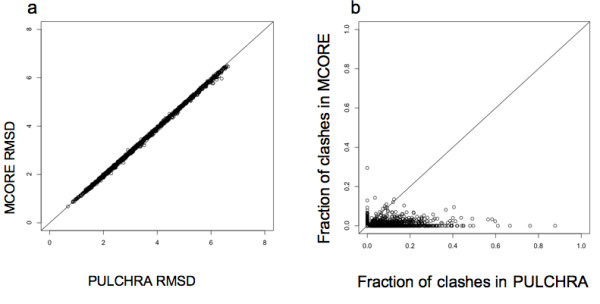
Comparison of PULCHRA models and MCORE models. (a) Scatter plot of the RMSD of PULCHRA models and respective MCORE refined models for a set of 1364 proteins (b) Scatter plot of the total number of clashes in PULCHRA models and corresponding refined models for the same set.