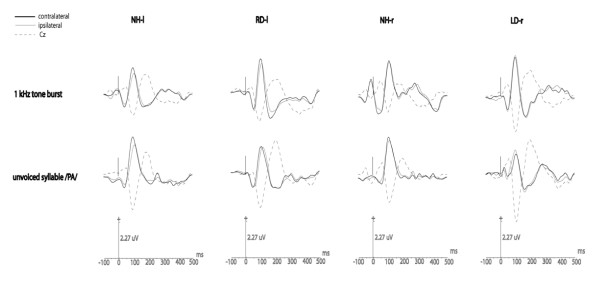
Figure 3.
Grand average of individual late-AEP responses relative to each stimulus over the temporal lobes ipsilateral and contralateral to the stimulation (corresponding grand average at Cz is shown as a dotted line: the waveform is reversed compared with that at the temporal lobes and serves the as reference).

