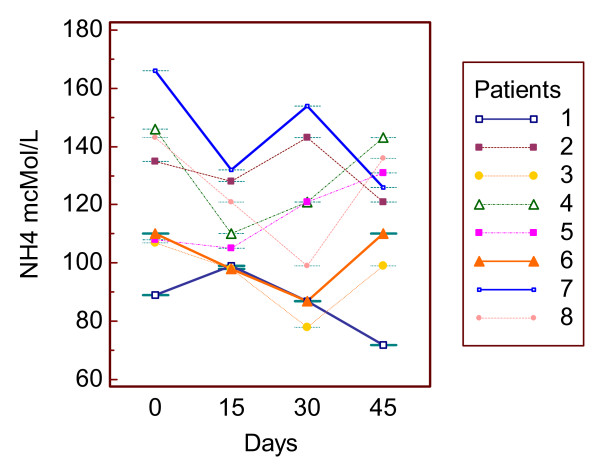
Figure 3.
Serial measurements. Clustered multiple comparison graph showing a good repeatability of blood ammonia concentration over time; median of the maximum difference versus first value percentage = -22.5, 95% C.I. -29.74 to 12.4; median of the AUC, (baseline = first value) = -577.5, C.I. = -1027.76 to 229.84; AUC, Area Under the Curve.

