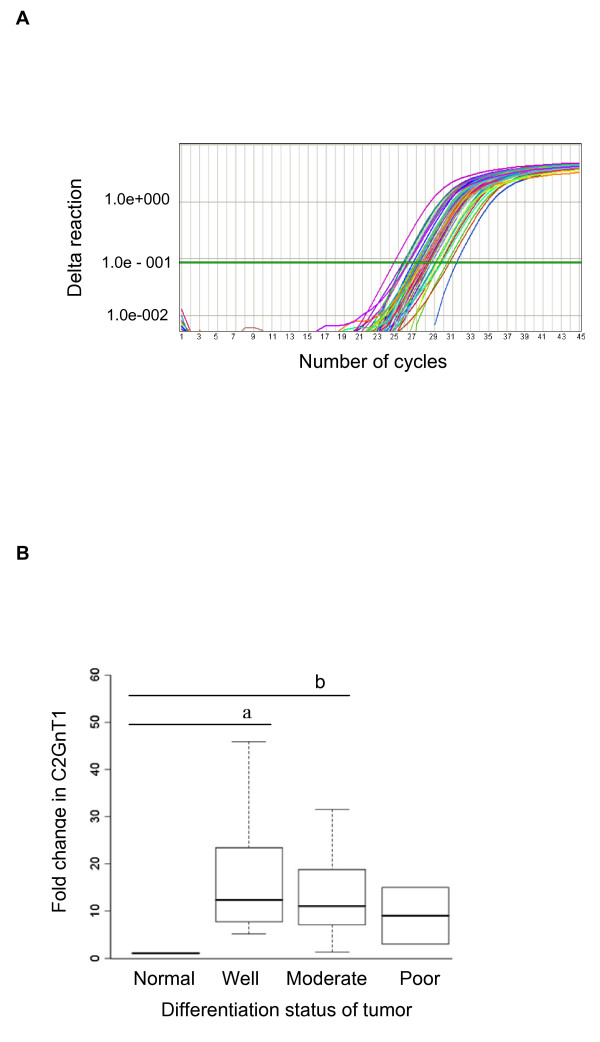
Figure 7.
C2GnT1 mRNA levels were upregulated in human colorectal adenocarcinomas compared to normal tissues. (A) Graph of amplification plots obtained by the Applied Biosystems 7500 Real-Time PCR system for C2GnT1 mRNA expression. (B) A box-plot showing the results of semi-quantitative RT-PCR analysis. The distribution of mRNA gene expression is shown as a fold change in C2GnT1 mRNA expression in normal colorectal tissues and in well, moderately, and poorly differentiated colorectal adenocarcinomas. A Kruskal-Wallis non-parametric test was performed for statistical comparison among the groups. a Denotes a significant difference (p = 0.015) between normal and well groups; b Denotes a significant difference (p = 0.025) between normal and moderate groups.

