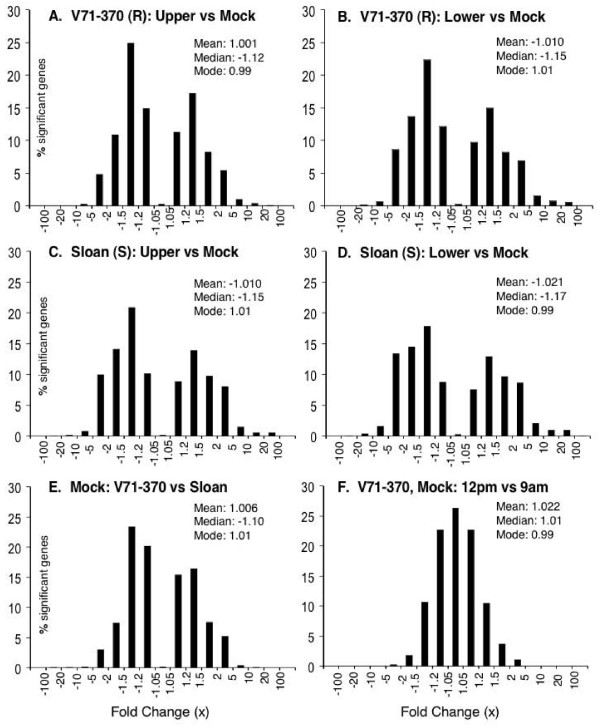
Figure 2.
Distribution of gene expression changes for different contrasts. Only genes with significant changes (TST-FDR-adjusted p ≤ 0.01) are included. A negative fold-change indicates a reduction by that factor. (A-D) Infection responses in resistant genotype V71-370 and susceptible genotype Sloan. "Upper" and "lower" denote infection courts as described in the text and the methods. Distributions of gene expression changes for VPRIL9 infection responses are shown [see Additional file 4]. (E) Gene expression differences between V71-370 and Sloan following mock inoculation; genes with higher mRNA levels in V71-370 or Sloan are shown as having a positive or negative differences, respectively. For (A)-(E), the fold changes were calculated using LMMA contrast analysis using GC-RMA normalized data. (F) Differences among 4,453 genes with significant responses to time of harvest in mock-inoculated Sloan plants: genes with higher mRNA levels in 12 noon samples or 9 am samples are shown as having a positive or negative differences, respectively. The fold changes were calculated from the average difference of the two treatments using the GC-RMA normalized data. The mean, median and mode of each distribution were calculated using the log-fold changes. The bin size of the mode was 0.01.

