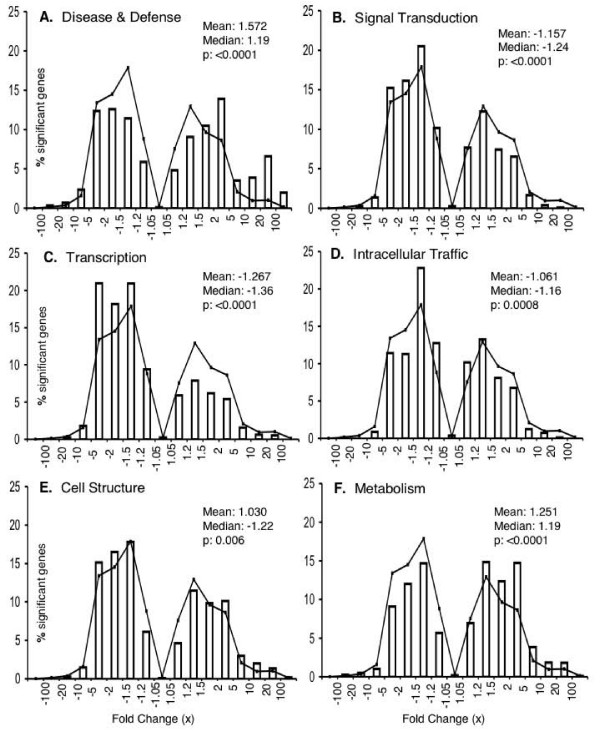
Figure 3.
Distributions of expression changes for genes within specific functional categories. Six functional categories relevant to infection are shown. Distributions are shown for genes showing significant infection responses (Lower vs Mock) in Sloan as revealed by LMMA analysis of GC-RMA preprocessed microarray data with TST-FDR adjusted p value ≤ 0.01. Distribution comparisons for other cultivars and infection courts are shown [see Additional files 5 to 7]. Histograms show the number of genes in each fold change range. The line graph connects points corresponding to the numbers of genes in all categories in each fold change range. A negative fold change indicates a reduction in expression by that factor. p values in each panel indicate the result of a Kolmogorov-Smirnov test comparing the distribution of expression changes within the category to the distribution for all genes. The mean and median of each distribution were calculated using the log-fold changes.

