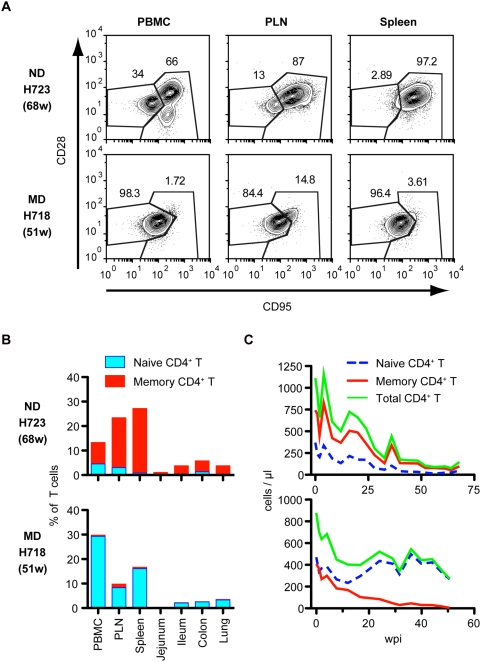
Figure 2. Representative flow cytometry and kinetics of CD4+ T cell loss in ND and MD macaques.
(A) CD4+ T cell subsets of PBMC, PLN, and spleen of macaques H723 and H718 are shown as representatives of ND and MD macaques, respectively. Naive (CD95lowCD28high) and memory (CD95highCD28high and CD95highCD28low) subsets of CD4+ T cells were analyzed by flow cytometry. (B) CD4+ T cell percentages and their subsets in various tissues from macaques, H723 (upper) and H718 (lower). Naive (blue) and memory (red) CD4+ T cells in total T cells are shown. (C) Kinetics of CD4+ T cell depletion in H723 (upper) and H718 (lower). Naive (blue dotted line), memory (red), and total (green) CD4+ T cell counts in blood are shown.

