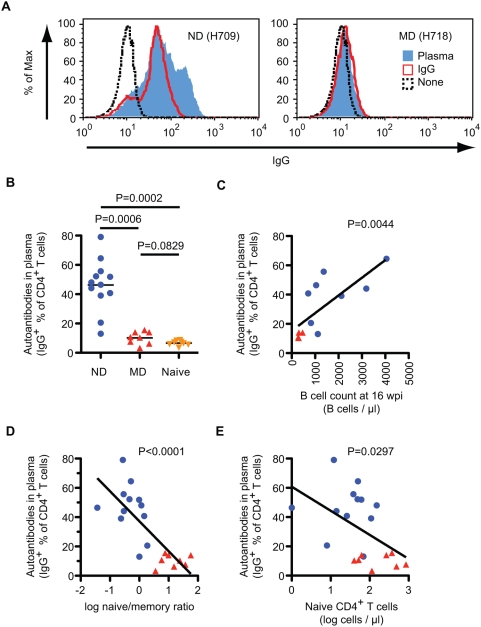
Figure 9. Plasma antibodies autoreactive to CD4+ T cells in ND macaques.
(A) Antibodies against CD4+ T cells were analyzed using plasma and purified IgG from infected macaques. PBMC from SIV-uninfected macaques were incubated with plasma (5-fold–diluted, blue line) or purified IgG (1.5 mg/ml, red line) from ND (H709, left) or MD (H718, right) macaques, and stained with antibodies against monkey IgG (FITC), CD3 (PerCP-Cy5.5), and CD4 (APC). A histogram of monkey IgG is shown after gating CD3+CD4+ cells. Dashed line; IgG reactivity of untreated PBMC. (B) Autoantibodies in terminal plasma samples were compared among ND (n = 12), MD (n = 8), and SIV-naïve (n = 8) macaques. Percentages of IgG+ cells in CD4+ T cells were determined by the Overton cumulative histogram subtraction using untreated PBMC as a control. (C) Correlation between autoantibodies to CD4+ T cells in plasma and B cell count in blood at 16 wpi. Percentages of IgG+ cells in CD4+ T cells and B cell counts were plotted using ND (blue circles, n = 8) and MD (red triangles, n = 4) macaques. A linear regression analysis indicated a regression line with a slope = 0.012±0.003 (R2 = 0.572). (D) Correlation between autoantibodies to CD4+ T cells in plasma and log naïve/memory ratio in CD4+ T cells at death. Percentages of IgG+ cells in CD4+ T cells and log naïve/memory ratio in CD4+ T cells were plotted using ND (blue circles, n = 12) and MD (red triangles, n = 8) macaques. A linear regression analysis indicated a regression line with a slope = −20.5±4.04 (R2 = 0.588). (E) Correlation between autoantibodies to CD4+ T cells in plasma and log naïve CD4+ T cell number at death. Percentages of IgG+ cells in CD4+ T cells and log absolute naïve CD4+ T cell number were plotted using ND (blue circles, n = 12) and MD (red triangles, n = 8) macaques. A linear regression analysis indicated a regression line with a slope = −16.5±6.97 (R2 = 0.237).

