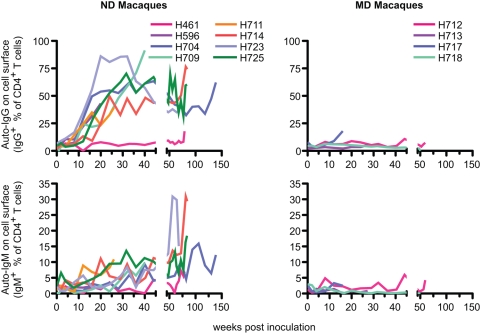
Figure 11. The kinetics of induction of antibodies autoreactive to CD4+ T cells.
Kinetics of IgG (upper) and IgM (lower) on the surface of CD4+ T cells from ND (left, n = 8) and MD (right, n = 4) macaques are shown graphically. Frozen PBMC samples were stained with antibodies against CD4 (FITC), human IgG, IgM, or IgG1 isotype control (PE), 7-AAD (PerCP), and CD3 (APC). Percentages of IgG+ or IgM+ cells in live CD4+ T cells (7-AAD−CD3+CD4+) were determined by the Overton cumulative histogram subtraction using mouse IgG1 isotype control.

