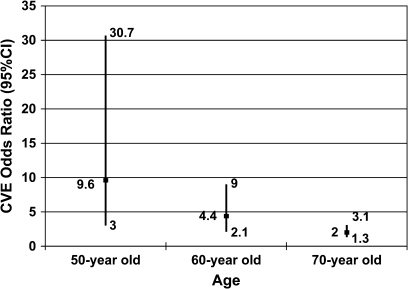
Figure 3.
ORs (95% CI) of complex ventricular ectopy in subjects with SDB according to age adjusted for coronary artery disease. This graph depicts the ORs (95% CI) of complex ventricular ectopy adjusted for coronary heart disease according to our final model given a 50-, 60-, and 70-yr-old person, respectively.

