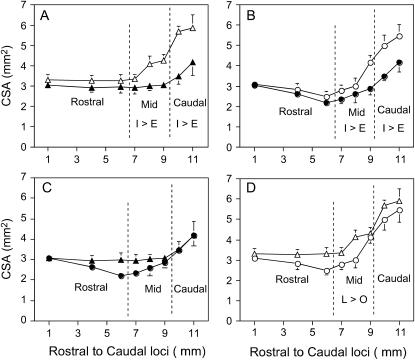
Figure 3.
Mean ± SEM cross-sectional area (CSA) at selected regions of the pharyngeal airway on inspiration (open circles and open triangles) and expiration (solid circles and solid triangles) in nine lean Zucker rats (triangles) and nine obese Zucker rats (circles). Top: Airway area on inspiration and expiration in lean Zucker rats (A) and obese Zucker rats (B). Bottom: Comparison of airway area in lean versus obese rats on expiration (C) and inspiration (D). The sequence of axial images on the abscissa begins with the most rostral image, location 1, proximal to junction of soft and hard palates, and extends to image 11, at the base of the epiglottis (see Figure 2). Overlying vertical dashed lines denote the boundaries of the rostral, mid-, and caudal pharyngeal regions. In A and B, the inspiratory CSA values within the mid- and caudal pharynx are significantly greater than the expiratory CSA in those respective regions (denoted as I > E in the designated region). When differences in region were accounted for, expiratory (C) and inspiratory (D) CSAs of lean rats were significantly greater than those of obese Zucker rats (see text for p values). In D, comparing inspiratory CSAs, the CSA in the midregion was significantly greater in lean Zucker rats than in obese Zucker rats (denoted as L > O, p < 0.05).

