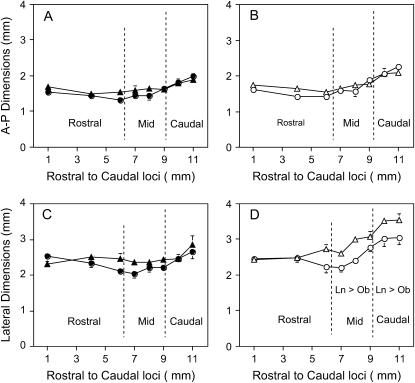
Figure 4.
Comparison of anteroposterior (A-P; top) and lateral (bottom) airway dimensions during expiration (solid symbols in A and C) and inspiration (open symbols in B and D) in nine lean Zucker rats (triangles) and nine obese Zucker rats (circles). Overlying vertical dashed lines denote the boundaries of the rostral, mid-, and caudal pharyngeal regions. Note that lateral dimensions during inspiration were significantly greater in lean Zucker rats compared with obese Zucker rats in the mid- and caudal pharynx (denoted Ln > Ob, p < 0.05).

