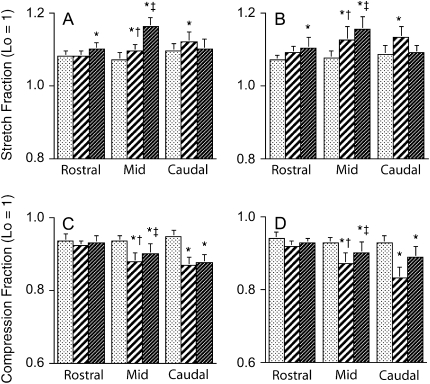
Figure 5.
Mean ± SEM λ1 (stretch; A and B) and λ2 (compression; C and D) in each pharyngeal wall sector (control [stippled columns], lateral [hatched columns], and ventral [dark columns]) and pharyngeal region (rostral, mid-, and caudal pharynx) in nine lean Zucker rats (A and C) and nine obese Zucker rats (B and D). Significant differences from control (p < 0.05) within a region are noted by an asterisk. In some regions, there were differences between lateral and ventral sector values, where values noted by (‡) are greater than values noted by (†); p < 0.05. There were no significant differences between lean and obese stretch or compression values, and thus significant differences among lateral ventral and control sectors are represented for both obese and lean groups although the analysis of variance (ANOVA) results were obtained from the combined group data. In the absence of any significantly different tissue stretch or compression within a sector between expiration and inspiration, the respective λ values would reflect only the spurious noise resulting from the sequential MR acquisitions. Lo = unit length (length normalized to 1) of a tissue sector before deformation.

