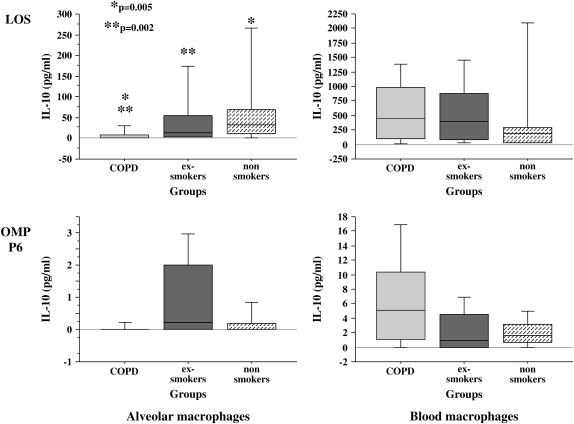
Figure 5.
LOS and OMP P6 induction of human alveolar and blood macrophage IL-10. Alveolar (left column) and blood macrophages (right column) were obtained from former smokers with COPD (Group 1), former smokers without COPD (Group 2), and nonsmokers (Group 3). Shading denoting each individual group and supernatant concentrations for IL-10 elicited by LOS (top graphs) and OMP P6 (lower graphs) at 1 μg/ml are as detailed in Figure 1. Data are represented by box plots for each group as detailed in Figure 1. Values correspond with data given in Table 6.

