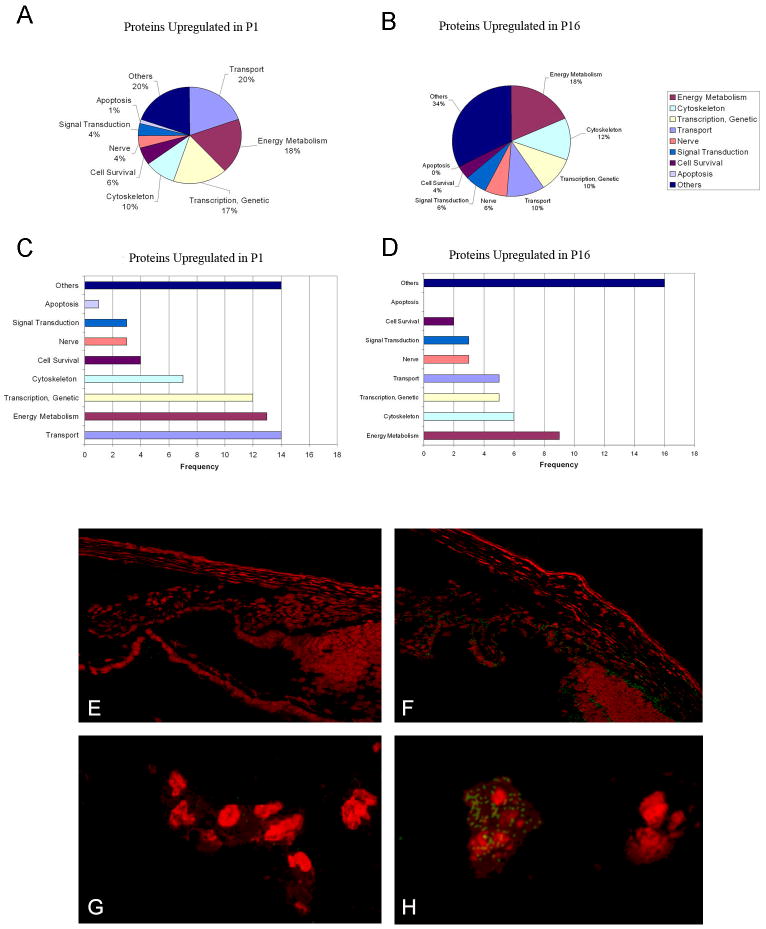
Figure 3.
A–D: Pie-chart/frequency bar graphs showing the summary of protein classes that were upregulated in P1 (A, C) and P16 (B, D). Differential expression of one of the inflammatory response proteins, kininogen, is shown in E–H, using goat anti kininogen primary antibodies and FITC donkey anti-goat IgG secondary antibodies (with PI counterstaining). Proteome analysis showed greater than two fold increase of kininogen on P16 as compared to P1. Immunoconfocal microscopy demonstrates localization of kininogen on P16 in the iris and ciliary body (3F) and tunica vasculosa lentis (3H); immunolocalization was undetectable on P1 (3 E, G).

