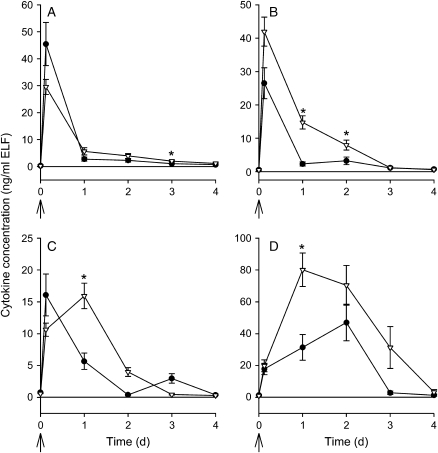
Figure 3.
Cytokine response after a single inoculation with P. aeruginosa. Wild-type (closed circles) and CF mice (open triangles) were inoculated with a single dose of P. aeruginosa. Mice were killed 3 h (n = 18/group), 1 d (18 mice/group), 2 d (27 mice/group), 3 d (11–13 mice/group), and 4 d (12–13/group) after infection, and represent mice from Figure 1B. BAL was performed and inflammatory mediators (A) macrophage inflammatory protein-2, (B) keratinocyte chemoattractant, (C) tumor necrosis factor-α, and (D) interleukin-6 were measured, as described. Data are normalized for urea dilution (ng/ml epithelial lining fluid [ELF]). Arrows indicate the timing of infection. Data points at t = 0 represent untreated mice. *Significantly different from wild-type control mice at the same time point (Van Elteren's test was used adjusting for differences between experiments and the Bonferroni method was used to adjust for multiple testing; p < 0.01 was considered significant).

