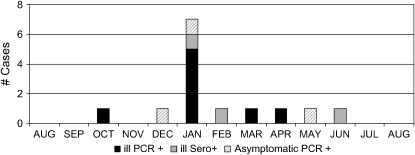
Figure 1.
Distribution of respiratory synctial virus (RSV) cases by month of identification. Cases associated with illness and reverse transcriptase–polymerase chain reaction (RT-PCR) positive nasal or sputum specimens are shown in black. Cases associated with illness and serologic response but RT-PCR negative nasal or sputum specimens are shown in gray. Asymptomatic RSV infections identified by RT-PCR are shown by diagonally lined bars. One asymptomatic infection identified by serology during the fall of 2004 is not displayed because it could not be assigned to a specific month.

