Figure 1.
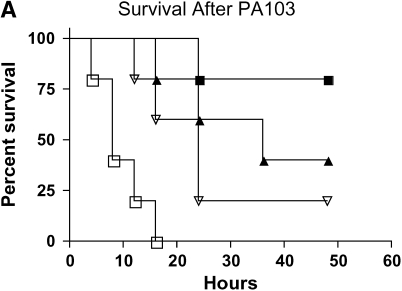
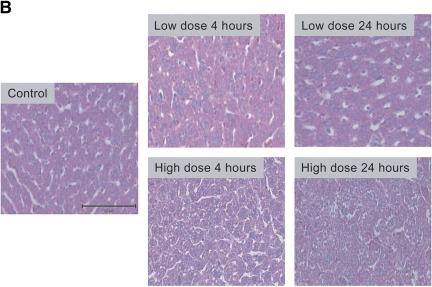
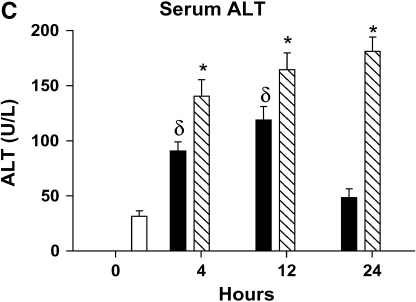
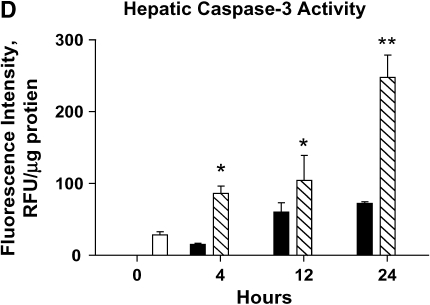
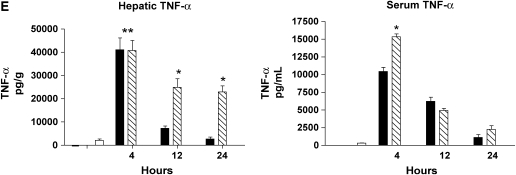
Severity of liver injury differs in mild and severe bacteremia. (A) C57BL/6 mice (n = 40) underwent endotracheal intubation and instillation of increasing doses of P. aeruginosa (strain PA103). Animals were monitored as described in Methods. Solid squares, 5 × 10³; solid triangles, 5 × 10⁴; inverted open triangles, 5 × 10⁵; open squares 5 × 10⁶ cfu. (B) At 4 and 24 h after generation of mild and severe bacteremia, livers were fixed in 4% paraformaldehyde. All images are hematoxylin and eosin stained. (Original magnification: ×20.) (C) Serum alanine aminotransferase (ALT) was measured after generation of mild and severe bacteremia. Each group represents seven mice. Severe bacteremia results in increased ALT compared with control and mild infection at all time points (*p < 0.001). In mild bacteremia, there was an increase in ALT compared with control at 4 and 12 h (δp < 0.001), but this returned to baseline by 24 h. (D) The caspase-3 assay shows an increase in caspase-3 activity in liver lysates at 12 and 24 h in the severe bacteremia model (*p < 0.01 and **p < 0.001, respectively). (E) Tumor necrosis factor α (TNF-α) was measured in liver lysates by ELISA. There was a significant increase in TNF-α levels at 4 h in mild and severe bacteremia compared with control (**p < 0.001). There was also an increase in hepatic TNF-α in severe bacteremia compared with mild bacteremia at 12 and 24 h (*p < 0.001). Serum TNF-α was increased in severe bacteremia at 4 h (*p < 0.05), but there was no difference at the later time points. C–E: solid bars, 5 × 10³ organisms; hatched bars, 5 × 10⁴ organisms; open bars, control.

