Figure 2.
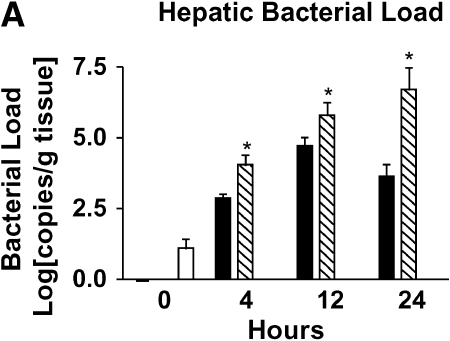
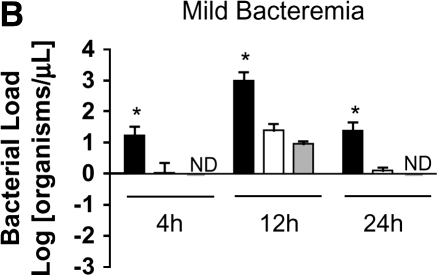
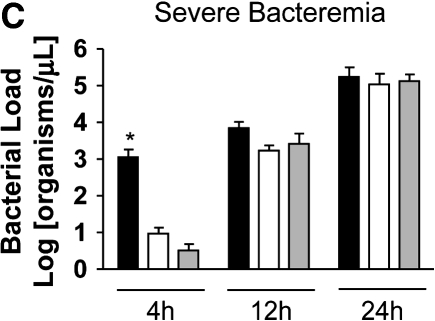
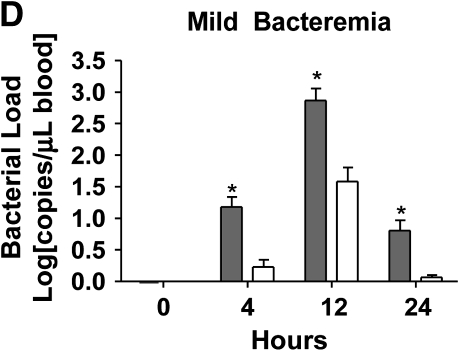
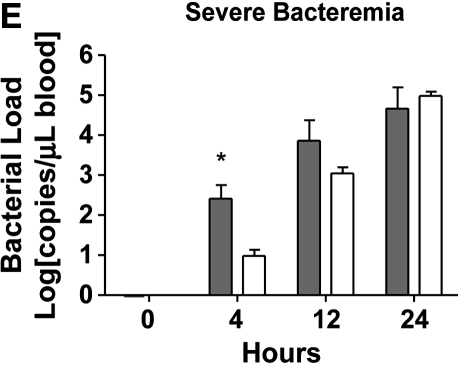
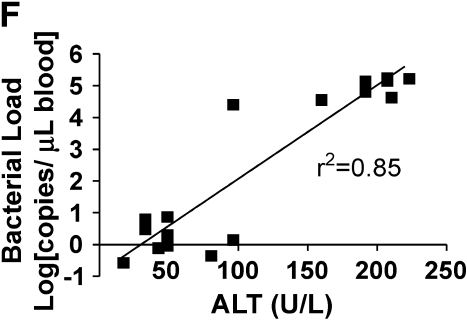
Loss of bacterial clearance occurs in severe bacteremia. (A) Bacterial load was measured in liver lysates after generation of mild or severe bacteremia by quantitative real-time PCR with primers specific for P. aeruginosa. Each group represents seven mice. A log transformation was performed to correct for unequal variances. There was increased bacterial load in severe bacteremia compared with mild bacteremia at all time points (*p < 0.001). Solid bars, 5 × 10³ organisms; hatched bars, 5 × 10⁴ organisms; open bars, control. (B) Bacterial load was measured in the portal vein (PV), right ventricle (RV), and hepatic vein (HV). In mild bacteremia, the use of the RV as a measure of hepatic bacterial clearance slightly underestimates the degree of bacterial clearance by the liver (*p < 0.05 comparing PV with RV and HV at all time points). ND = none detected. (C) In severe bacteremia, use of the RV slightly underestimates bacterial clearance at 4 h; however, bacterial clearance by the liver is lost at 12 h using HV and RV bacterial load. B, C: solid bars, PV; open bars, RV; shaded bars, HV. (D) In mild bacteremia, PV bacterial load is greater than RV bacterial load at all time points (*p < 0.05) Shaded bars, PV; open bars, RV. (E) In severe bacteremia, PV bacterial load is greater than that in the RV at 4 h (*p < 0.05). However, there is no difference at 12 or 24 h, suggesting ineffective bacterial clearance. (F) Serum ALT was compared with RV bacterial load at 24 h after infection. Linear regression analysis shows a significant correlation between degree of liver injury and the amount of bacteria in the RV (r2 = 0.85).

