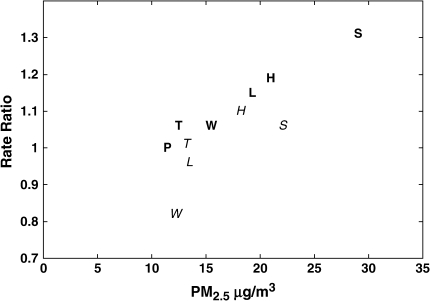
Figure 2.
Estimated adjusted rate ratios for total mortality and PM2.5 levels in the Six Cities Study by period. P denotes Portage, WI (reference for both periods); T = Topeka, KS; W = Watertown, MA; L = St. Louis, MO; H = Harriman, TN; S = Steubenville, OH. A term for Period 1 (1 if Period 2, 0 if Period 1) was included in the model. Bold letters represent Period 1 (1974–1989) and italicized letters represent Period 2 (1990–1998). In Period 1, PM2.5 (μg/m3) is defined as the mean concentration during 1980–1985, the years where there are monitoring data for all cities (18). In Period 2, PM2.5 is defined as the mean concentrations of the estimated PM2.5 in 1990–1998.

