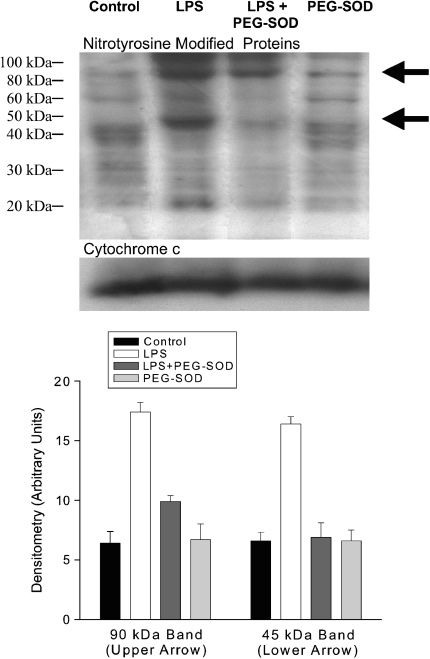
Figure 2.
Nitrotyrosine modification of mitochondrial proteins. Representative Western blot (top) probed with antinitrotyrosine antibody for cardiac mitochondrial samples from control, LPS-, LPS + PEG-SOD–, and PEG-SOD– treated animal groups. Samples were reprobed with anti–cytochrome c (bottom blot) as a protein-loading control. LPS was associated with a large increase in nitrotyrosine side-group formation for two proteins (arrows), including a protein of ∼ 90-kD molecular weight (top band) and a second protein with a 45-kD molecular weight (bottom band). Concomitant administration of PEG-SOD blocked LPS-induced increases in these two nitrotyrosine bands. Group mean data are shown in the lower graph; LPS increased nitrotyrosine content of the top and bottom protein bands; p < 0.001 for comparison of control to LPS for the top protein band, p < 0.001 for comparison of control to LPS for the bottom protein band. Both top and bottom protein bands were lower for the LPS + PEG-SOD group than for the LPS group; p < 0.001 and p < 0.001, respectively.

