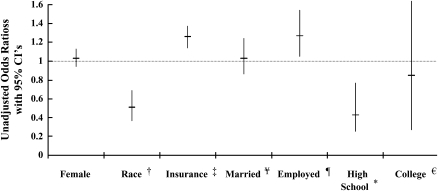
Figure 3.
Associations between socioeconomic/demographic characteristics and trial participation. †Odds ratio (OR) compares nonwhite to white patients; ‡OR compares patients older than 18 yr with commercial insurance to those with noncommercial insurance; ¥OR compared patients who are married with those who are single; ¶OR compares patients older than 18 yr who are employed compared with those who are unemployed; *OR compares patients older than 18 yr with a high school degree with those without a degree; ∈OR compares patients older than 25 yr with a college degree or higher with those without a high school degree.

