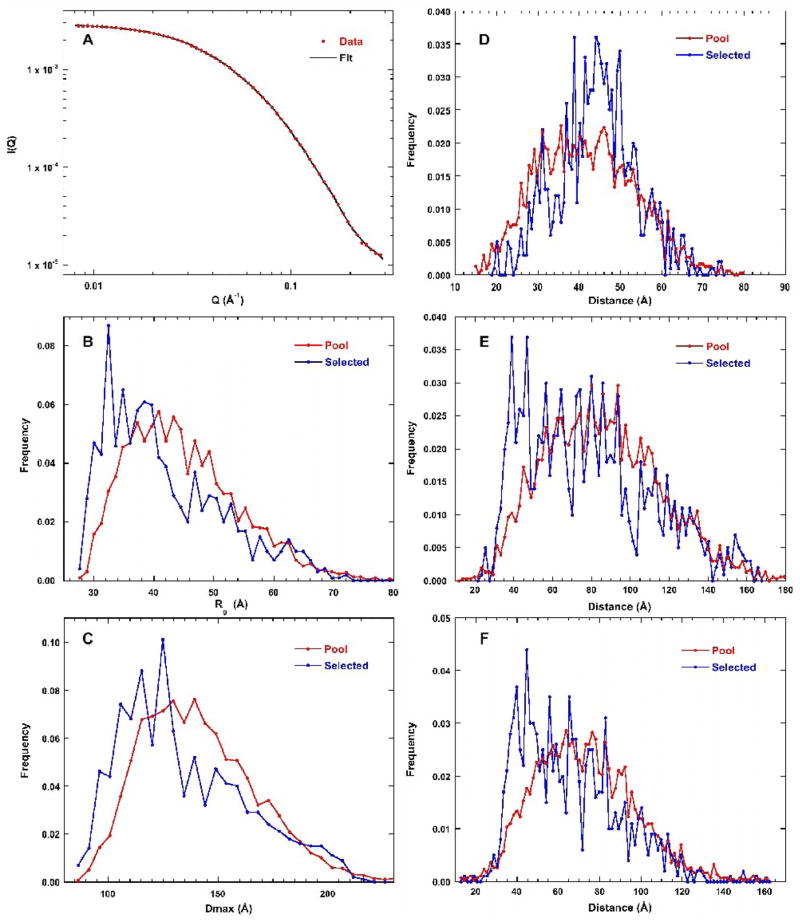
Figure 3.
EOM analysis of PKR SAXS data. A) Scattering profile. The red points are the experimental data (2mg/mL) and the solid black line is the fit. Error bars are omitted for clarity and correspond to those shown in figure 2A. For details see Materials and Methods. B) Rg distribution. The red line is the pool and the blue line corresponds to the ensemble of structures selected by the genetic algorithm. The same color convention is used for B–F. C) Dmax distribution. D) Distribution of dsRBM1 - dsRBM2 distances. E) Distribution of dsRBM1 - kinase distances. F) Distribution of dsRBM2 - kinase distances.

