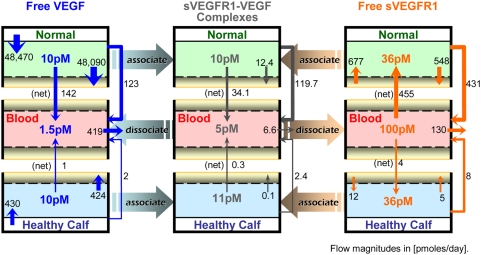
Figure 4. Basal Steady-State Flow Profiles of Free VEGF (left), sVEGFR1-VEGF Complexes (middle), Free sVEGFR1 (right).
Solid-colored arrows represent intra-compartmental flows (i.e., secretion, internalization) and inter-compartmental flows (i.e., net vascular permeability, lymph flow, plasma clearance), with their relative magnitudes reflected by arrow widths. Color-graded arrows between columns indicate mass transfer flows between species (i.e., net association of free VEGF and free sVEGFR1 to form sVEGFR1-VEGF complexes, or net dissociation of the complex back into its constituents).

